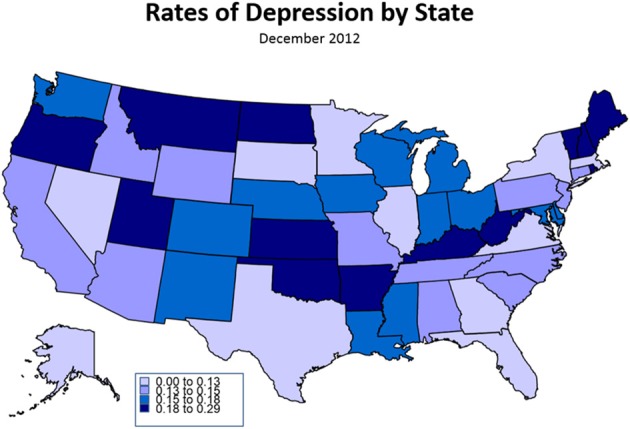
Figure 1.

Rates of Self-Reported Depression by State, December 2012. This infographic characterizes rates of self-reported depression by state, with darker states showing greater rates of depression. The image demonstrates few patterns in depression by geography, with perhaps the exception that state with large metropolitan areas tend to show somewhat less depression.
