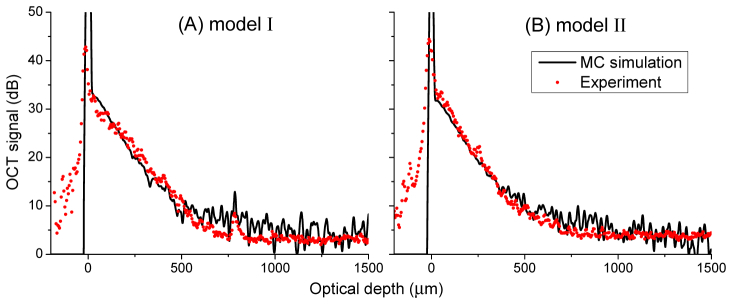
Fig. 8.

Quantitative comparison of the experimental and simulated OCT A-scans from alumina samples (model I and II). The averaged A-scans (over 50 A-lines) extracted from A) Fig. 5(b) and B) Fig. 5(d) are shown as red dots, and the simulated averaged A-scan for λ = 1.7 µm, alumina is shown as the black line. The simulated A-scans are truncated at a dynamic range of 50dB in this figure.
