
Fig. 9.
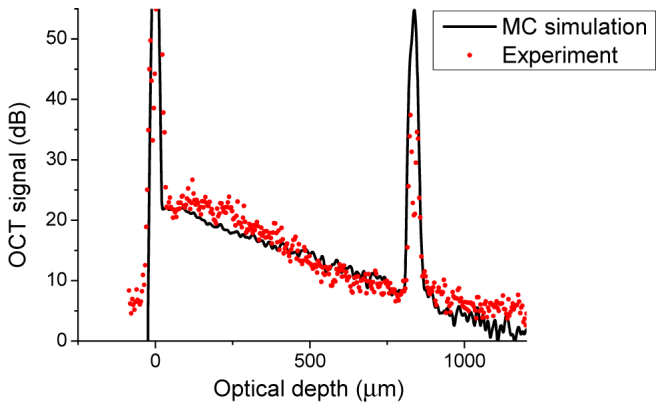
Quantitative comparison of the experimental and simulated OCT A-scans from zirconia sample. The averaged A-scan, extracted from Fig. 6, is shown as red circle and the simulated averaged A-scan is shown as black line.
Official websites use .gov
A
.gov website belongs to an official
government organization in the United States.
Secure .gov websites use HTTPS
A lock (
) or https:// means you've safely
connected to the .gov website. Share sensitive
information only on official, secure websites.
Quantitative comparison of the experimental and simulated OCT A-scans from zirconia sample. The averaged A-scan, extracted from Fig. 6, is shown as red circle and the simulated averaged A-scan is shown as black line.