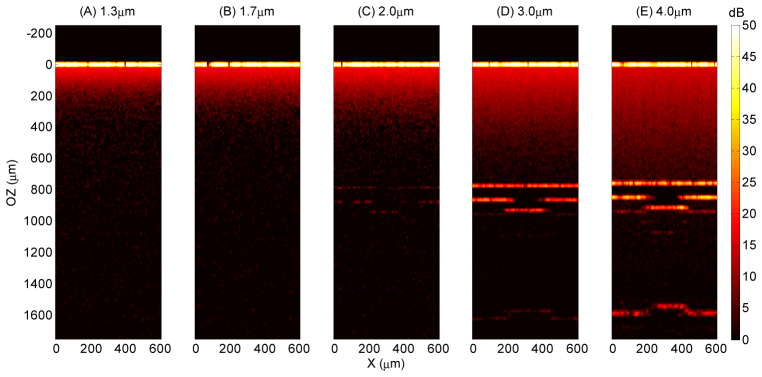
Fig. 11.

Simulated OCT images of alumina obtained by model II (90 nm rms roughness of the surfaces of the upper layer appearing at optical distances OZ = 0 and around 780 µm) for the five indicated wavelengths, where dispersion is accounted for λ = 3 µm and 4 µm. The vertical axis represents the optical distance as shown to the far left and the color-coded calculated intensity is given to the far right. The inverted channel signature at the bottom boundary is caused by shorter optical path through the air (black) in the channel.
