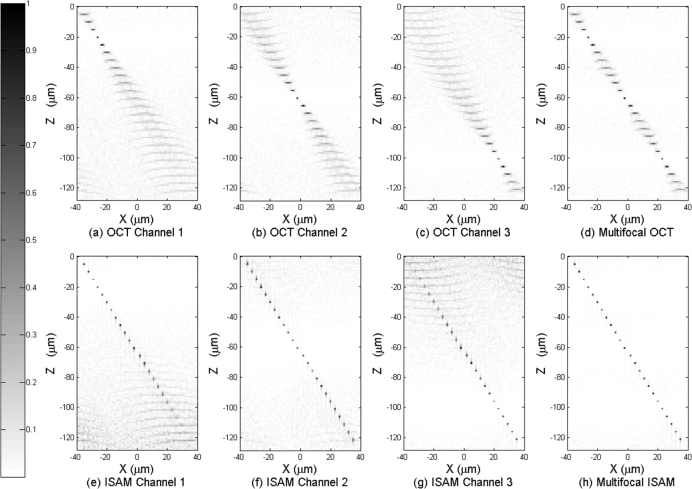
Fig. 3.
Panels (a)–(c) are three channels of OCT data, each focused at −20 μm, −60 μm, and −100 μm respectively, (the contrast has been lowered to show the signal far from focus). Panel (d) is the multifocal OCT reconstruction based on (a)–(c). Panels (e)–(g) are three channels of ISAM reconstruction based on (a)–(c) respectively. Panel (h) is the MISAM reconstruction based on (e)–(g). The MISAM image shows spatially invariant resolution and superior SNR.

