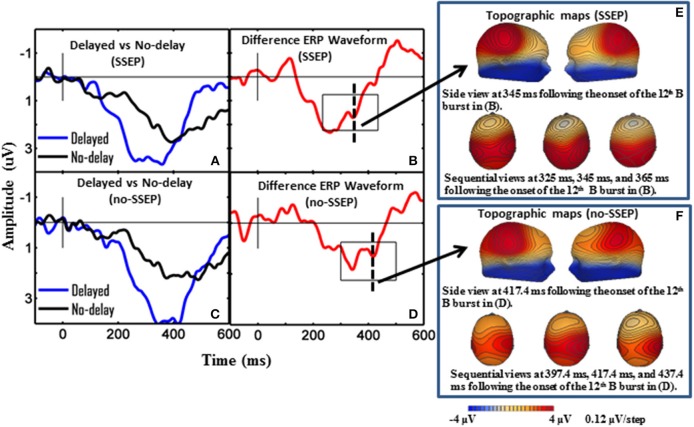
Figure 3.
Grand-mean ERP waveforms and grand-mean ERP deviant-to-standard difference waveforms from CPz. Panels (A–D), respectively show attentive listening for the SSEP stimuli, attentive listening for the no-SSEP stimuli, passive listening for the SSEP stimuli, and passive listening for the no-SSEP stimuli. The topographic maps for the P3b peaks are shown in (E) (SSEP stimuli) and panel (F) (no-SSEP stimuli). The solid vertical lines depict the onsets of the 12th B bursts. The thick dashed vertical lines in (B,D) mark the P3b peaks. The boxes surrounding the peaks in (B,D) show the analysis windows for the P3b activity.

