FIGURE 1.
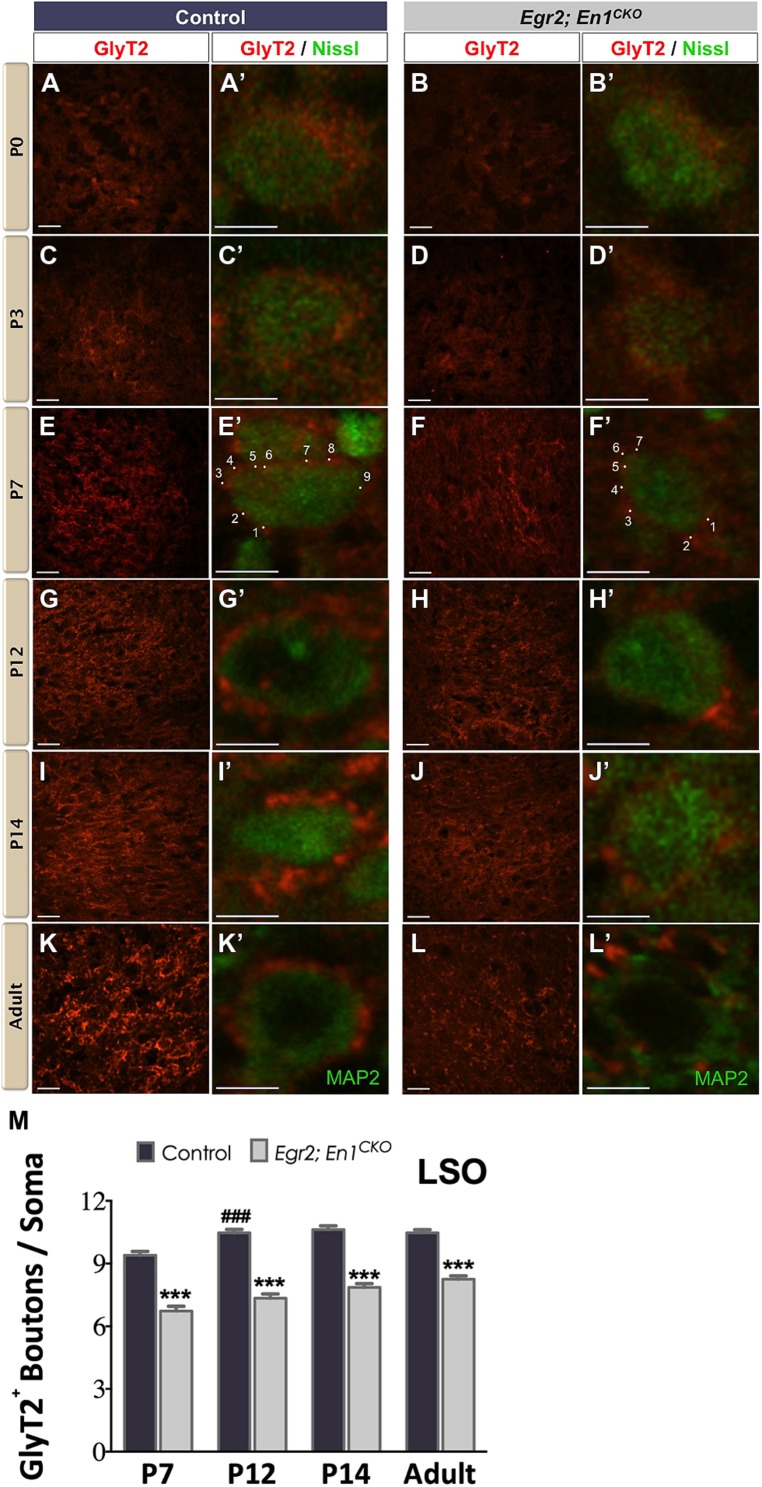
Development of glycinergic innervation to the LSO of control and Egr2; En1CKO mice. Diffuse GlyT2 immunoreactivity was detected as early as P0 in control (A,A’) and Egr2; En1CKO mice (B,B’). Slight increases in staining intensity were seen in P3 control (C,C’) and Egr2; En1CKO mice (D,D’). By P7, boutons located on LSO neuronal somata were easily discernible in both control (E,E’) and mutant mice (F,F’), albeit to a lesser extent in the latter. Individual boutons are shown with dots and numbers. By P12, levels of glycinergic innervation were increased in control mice (G,G’) but remained constant in Egr2; En1CKO mice (H,H’) compared to P7. Compared to controls (I,I’,K,K’), Egr2; En1CKO mice had reduced glycinergic innervation at two weeks of age and in adulthood (J,J’, L,L’). The number of GlyT2+ boutons was counted in P7 and older mice when boutons were easily recognizable. Reductions in somatic GlyT2+ bouton number occurred in Egr2; En1CKO mice compared to control littermates at all ages examined (M). Data are represented as mean ± SEM. Higher magnification images of individual neurons are shown in (A’–L’). Scale bars: 20 μm (A–D); 26 μm (E–L); 8 μm (A’–L’). ***P < 0.001 vs. age-matched controls, ###P < 0.001 vs. genotype-matched P7 mice.

