FIGURE 4.
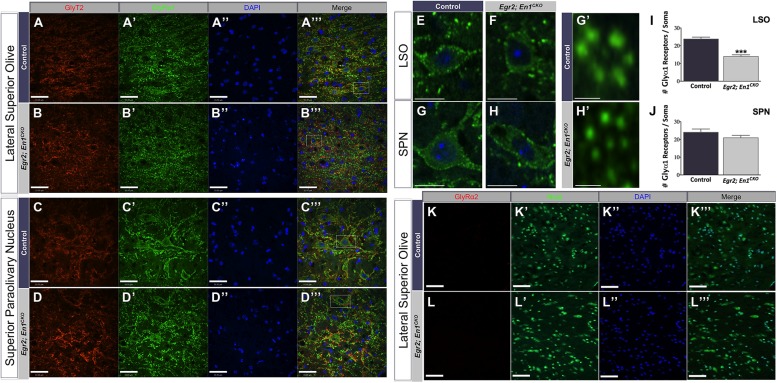
Glycine receptor isoform expression patterns, but not receptor number, are similar in LSO and SPN neurons of adult control and Egr2; En1CKO mice. Adult control and Egr2; En1CKO mouse brain sections through the LSO (A,B) and SPN (C,D) were immunostained for GlyT2 (A–D) and the glycine receptor isoform alpha 1 (GlyRα1; A’–D’). (E–H) Higher magnification images showing punctate staining on LSO (E,F) and SPN (G,H) neuronal somata and dendrites are shown in control (E,G) and Egr2; En1CKO (F,H) mice. (G’,H’) High magnification images of typical GlyRα1 rosettes. Counts of GlyRα1+ puncta per LSO (I) or SPN (J) neuronal soma revealed decreased numbers in the LSO, but not SPN, of Egr2; En1CKO compared to control mice. Data are represented as mean ± SEM. Glycine receptor alpha 2 (GlyRα2) was not expressed by LSO neurons in adult control (K) or Egr2; En1CKO mice (L). DAPI (A–D”,K”,L”) and Nissl (K’,L’) counterstains are also shown. Scale bars: 33 μm (A–D,K,L); 12 μm (E–H); 2.3 μm (G’,H’). ***P < 0.001 vs. control.

