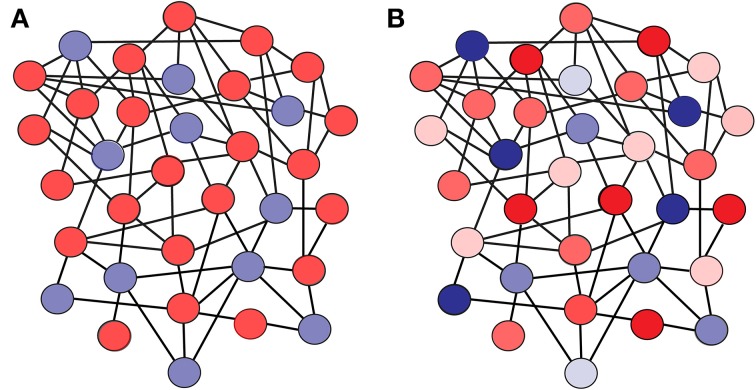
Figure 1.
Scheme of a network where (A) all the neurons have identical firing thresholds, and (B) each neuron in the network has a particular firing threshold value. The color code illustrates the value of the firing threshold for each neuron (lighter color tones mean lower firing threshold, while darker tones mean higher firing thresholds). Excitatory neurons are shown in red, and inhibitory neurons in blue.

