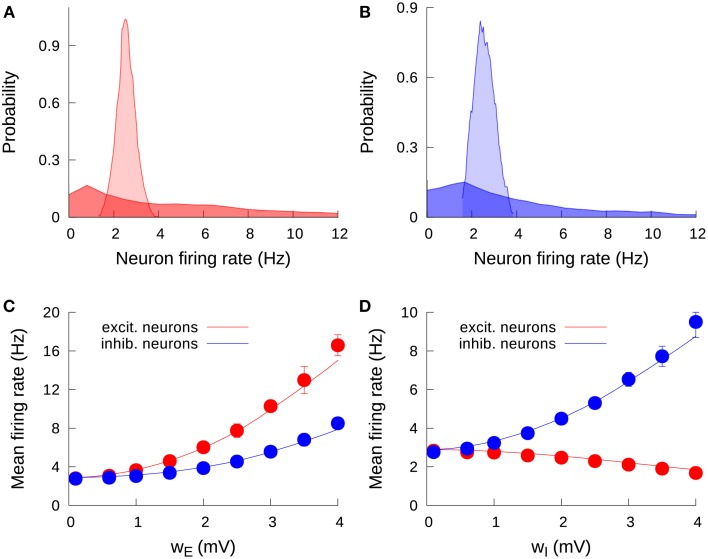
Figure 2.
Effect of heterogeneity on the stationary firing rates. (A) Probability density function of individual mean firing rates of excitatory neurons, for wE = 0.1 mV (light red) and wE = 2 mV (dark red). One can observe the spread of firing rate values as a consequence of the increase in the excitatory heterogeneity. (B) Distribution of individual mean firing rates of inhibitory neurons, for wI = 0.1 mV (light blue) and wI = 2 mV (dark blue). (C) Effect of the excitatory heterogeneity on the network mean firing rate. Solid lines correspond to the mean-field solution, while symbols are the results from numerical simulations. Here and in the following, error bars (which may be within symbol size) denote standard deviation over trials. (D) Same as in (C), but for the effect of inhibitory heterogeneity. We set a fixed value wI = 0.1 mV for (A,C), and wE = 0.1 mV for (B,D). For all panels, the external input is determined by μ = μ0 = 15 mV. Note the different scale for the vertical axis in (C,D).

