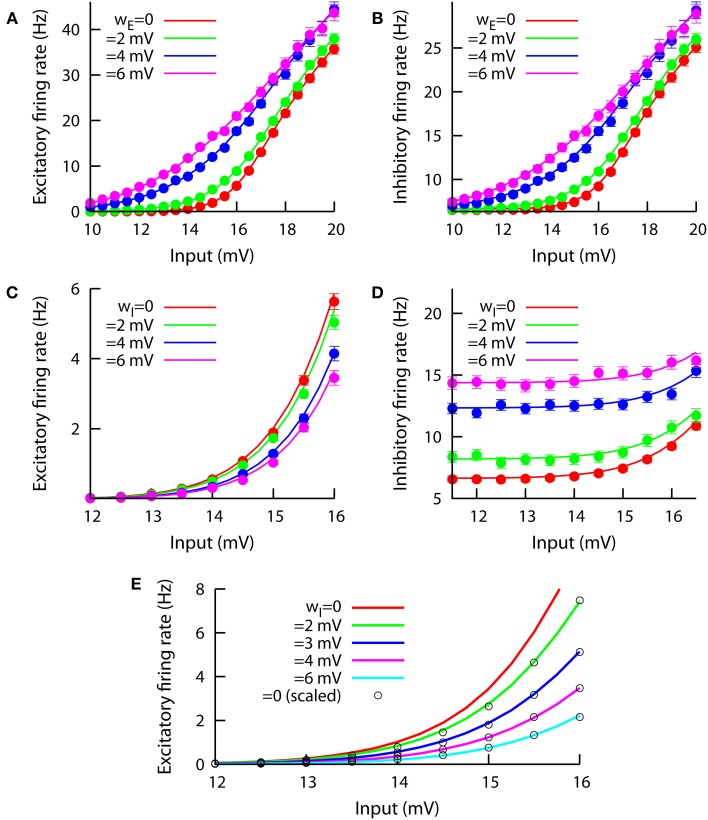
Figure 3.
Effect of modifying wE (top panels A,B, we keep wI = 0.1 mV) and wI (bottom panels C,D, we keep wE = 0.1 mV) on the f-I curves of the system. The input in the horizontal axis corresponds to the external excitatory input μ. The inhibitory bias remains at μ0 = 17 mV at all times. Left panels show the effect on the excitatory population, while right panels do the same for the inhibitory population. In (C), one can observe a clear divisive gain control of the excitatory f-I curve when wI varies. This divisive effect is not present in the inhibitory f-I curve, as (D) shows. (E) The same divisive effect as in (C) is displayed, but for μ0 = 12 mV and JEI = −0.4 mV. Circles correspond to the wI = 0 case (red line) but rescaled by a constant factor to fit the other cases, indicating that the effect of wI can be described as divisive gain control. The constant factor ζ used to rescale the wI = 0 f-I curve was obtained for each case by minimization of the squared distance Δ (see main text) and the resulting values are, for increasing wI, the following: 0.772, 0.531, 0.355, and 0.223.

