Figure 5.
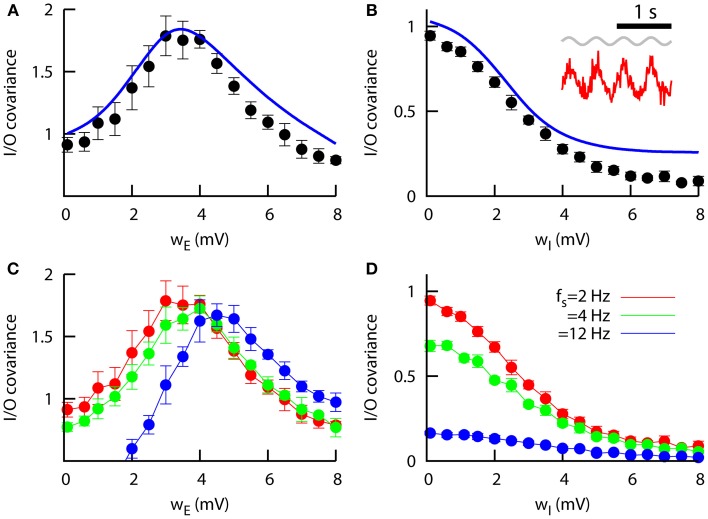
Signal transmission in networks of heterogeneous neurons. (A) Zero-lag input–output covariance as a function of the excitatory heterogeneity in the network, for wI = 0.1 mV. The peak indicates that a specific level of heterogeneity optimizes signal transmission. The mean-field approach (line) reproduces the numerical findings (symbols). Other parameters are JEE = JIE = 0.043 mV, JEI = JII = −0.06 mV, and μ = μ0 = 15 mV, and the signal is characterized by S0 = 0.5 mV and fs = 2 Hz. (B) Same as in (A), but as a function of the inhibitory heterogeneity and for wE = 0.1 mV. Inset: example of a slow, weak sinusoidal signal (in gray) driving the excitatory mean firing rate (in red). This situation would correspond to the peak in (A) (optimal I/O covariance). (C) Same as (A), but for different input frequencies. Only numerical results (averaged over 15 trials) are presented in this case, since the mean-field predictions does not hold for high input frequencies. (D) Same as (B), but for different input frequencies and only considering the numerical results. (C,D) share the same color code.

