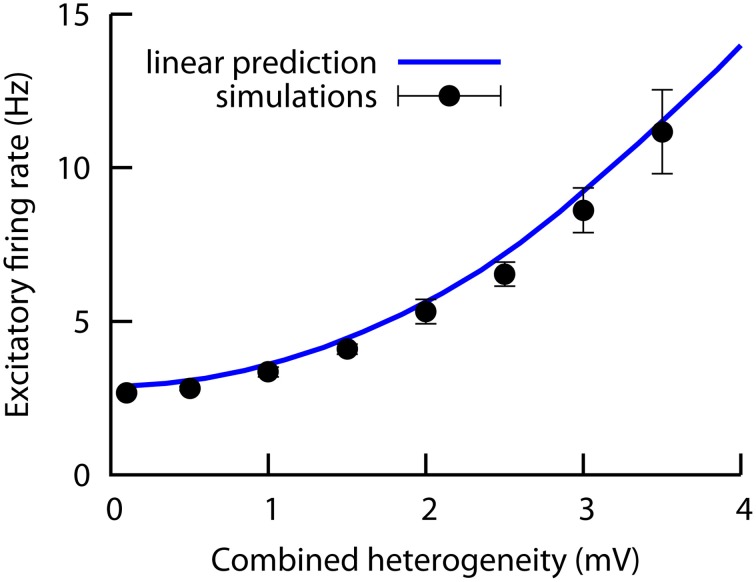
Figure 6.
Numerical results (symbols) of the excitatory firing rate for a network in which both the excitatory and the inhibitory heterogeneity levels are increased simultaneously (i.e., we plot the excitatory firing rate as a function of the combined heterogeneity, defined as W = wE = wI). The solid line is obtained with the mean-field curves of Figures 2C,D (red curves), and assuming that both contributions add up in a linear fashion. The agreement between simulations and the mean-field under the linear hypothesis indicates that the system behaves linearly in this case. All parameters as in Figures 2C,D.

