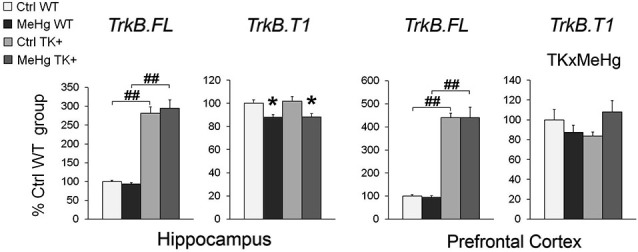
Figure 6.

Expression of the full-length TrkB.FL and truncated TrkB.T1 transcripts. MeHg exposure did not affect the TrkB.FL expression but reduced the TrkB.T1 levels in the hippocampus and interacted with TK genotype for TrkB.T1 in the prefrontal cortex. Two-way ANOVA analysis: TK × MeHg significant interaction of the factors TK and MeHg. Post hoc Tukey’s group comparisons: * P < 0.05 MeHg vs. respective Ctrl group; ## P < 0.01 TK+ vs. respective WT group. N = 7–9 Ctrl WT, 8–11 MeHg WT, 9 Ctrl TK+ and 6–7 MeHg TK+ mice.
