
Figure 2.
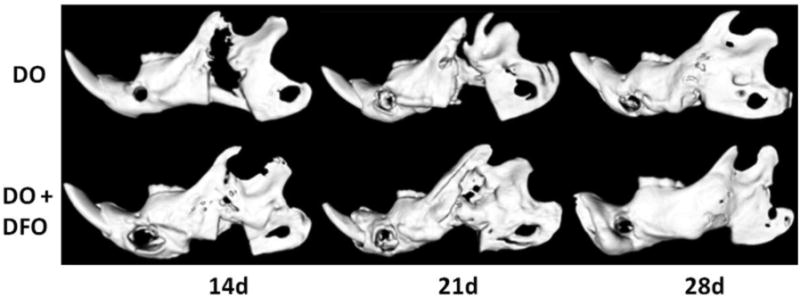
Select μCT images demonstrating the DO group (top row) and the DO + DFO group (bottom row) at each time point. At the earlier 14 and 21d time-points, note the visible augmentation in regenerate radiodensity in the treatment group indicative of accelerated consolidation with therapy.