
Figure 5.
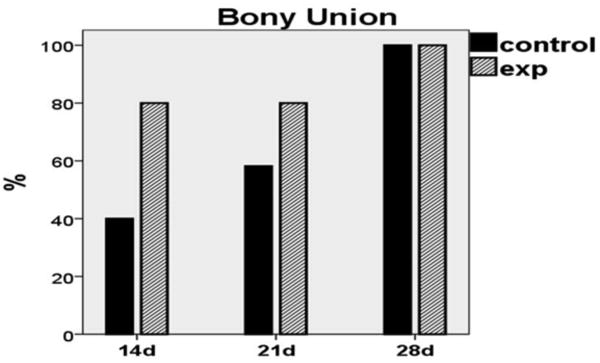
Graph demonstrating bony union rates within groups. Note the doubling of bony unions in the experimental group at 14d when compared to non-treated controls. At 21d, control union rate increased by 20%; however, experimental union rate remained increased by comparison. By 28 days, both groups exhibited 100% bony union rate.