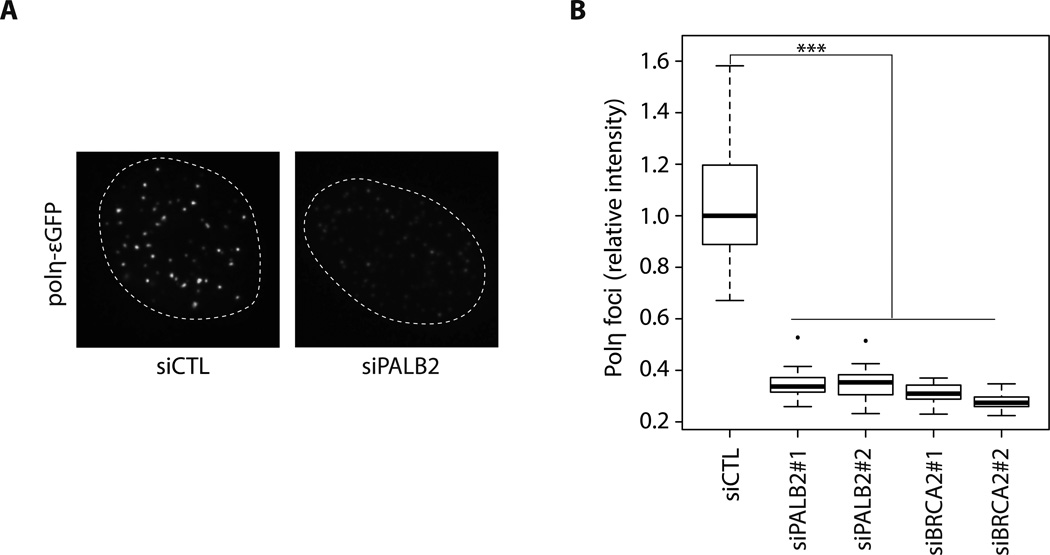
Figure 2. Knockdown of PALB2 or BRCA2 decreases Polη foci formation.
(A) A representative example of Polη-εGFP foci intensity in cells transfected with a control siRNA or PALB2 siRNA. (B) Quantification of Polη-εGFP foci intensity induced by HU treatment in control, PALB2 or BRCA2 knockdowns. *** P < 0.001. The median is represented by a black line.

