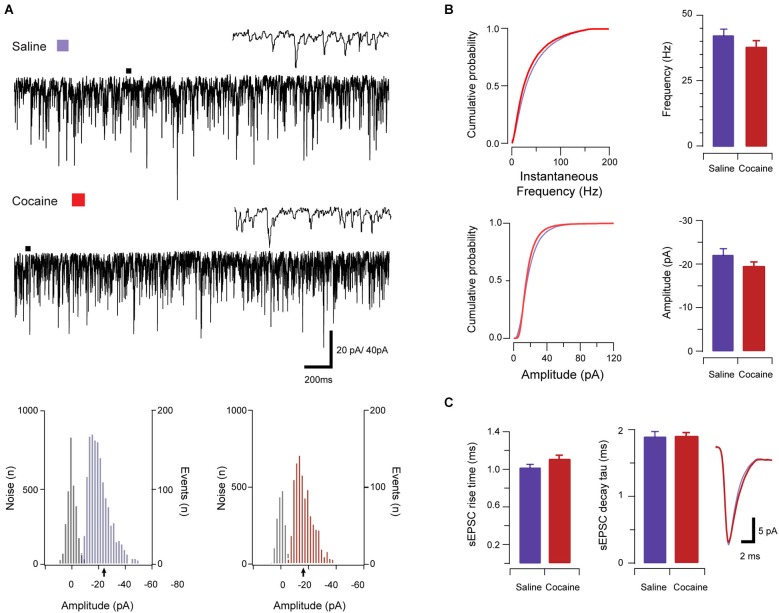
Figure 2.
Spontaneous excitatory synaptic transmission in saline- and cocaine-exposed animals. Traces show 3 s of continuous recordings from aPVT neurons in saline- (A, upper) and cocaine-exposed animals (A, middle), with corresponding amplitude histograms (including baseline noise distributions) below and arrows indicating the mean (saline, mean amplitude = −22 pA, A, lower left; cocaine, mean amplitude = −18 pA A, lower right). Cumulative probability distributions (from representative recordings) and bar graphs showed no differences in both instantaneous frequency (B, upper) and amplitude (B, lower) of aPVT neurons in response to saline or cocaine. Group data plots (C) show rise time and decay time constant remained similar in both saline and cocaine treatment groups (n = 25 and n = 24, with an average of 1387 events and 1192 events analyzed respectively), with representative traces of rise and decay.

