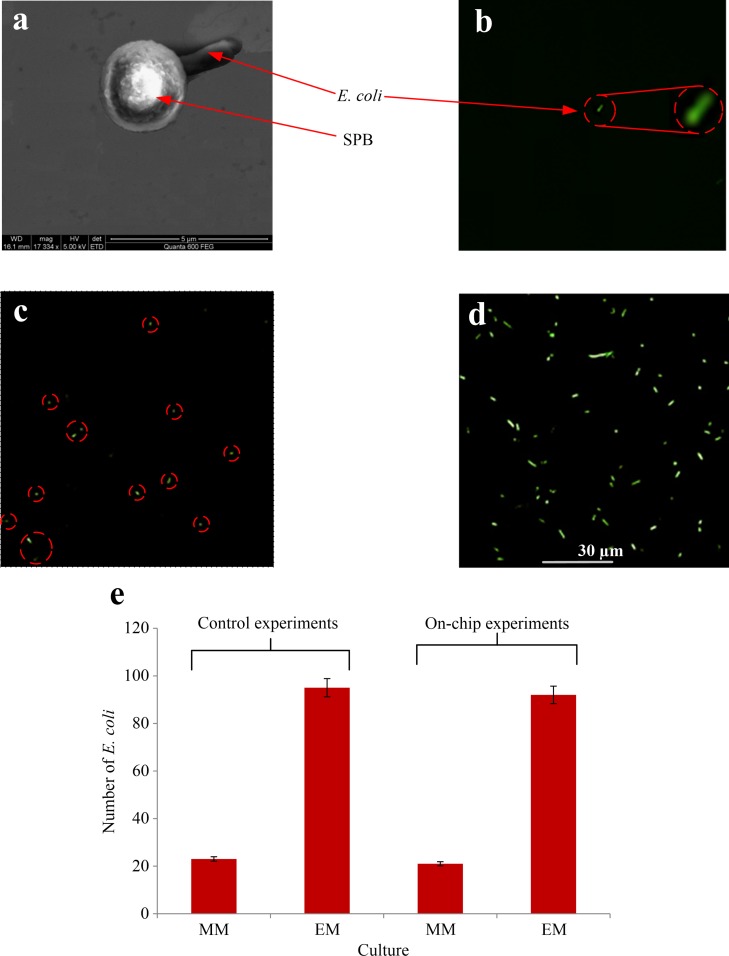
FIG. 7.
(a) SEM image of single E. coli attached to one SPB. (b) Fluorescent image of a single E. coli at the beginning of the culturing experiment. (c) and (d) Fluorescent images of side chambers 1 (minimal media) and 2 (enriched media), respectively, taken after 6 h of culturing. (e) The number of E. coli after 6 h culturing, using minimal media (MM) and enriched media (EM). The results in columns 1 and 2 are obtained from control experiments. Columns 3 and 4 show the results obtained from E. coli tagged with an SPB and isolated with the microfluidic chip into side chamber 1 (minimal media) and 2 (enriched media).

