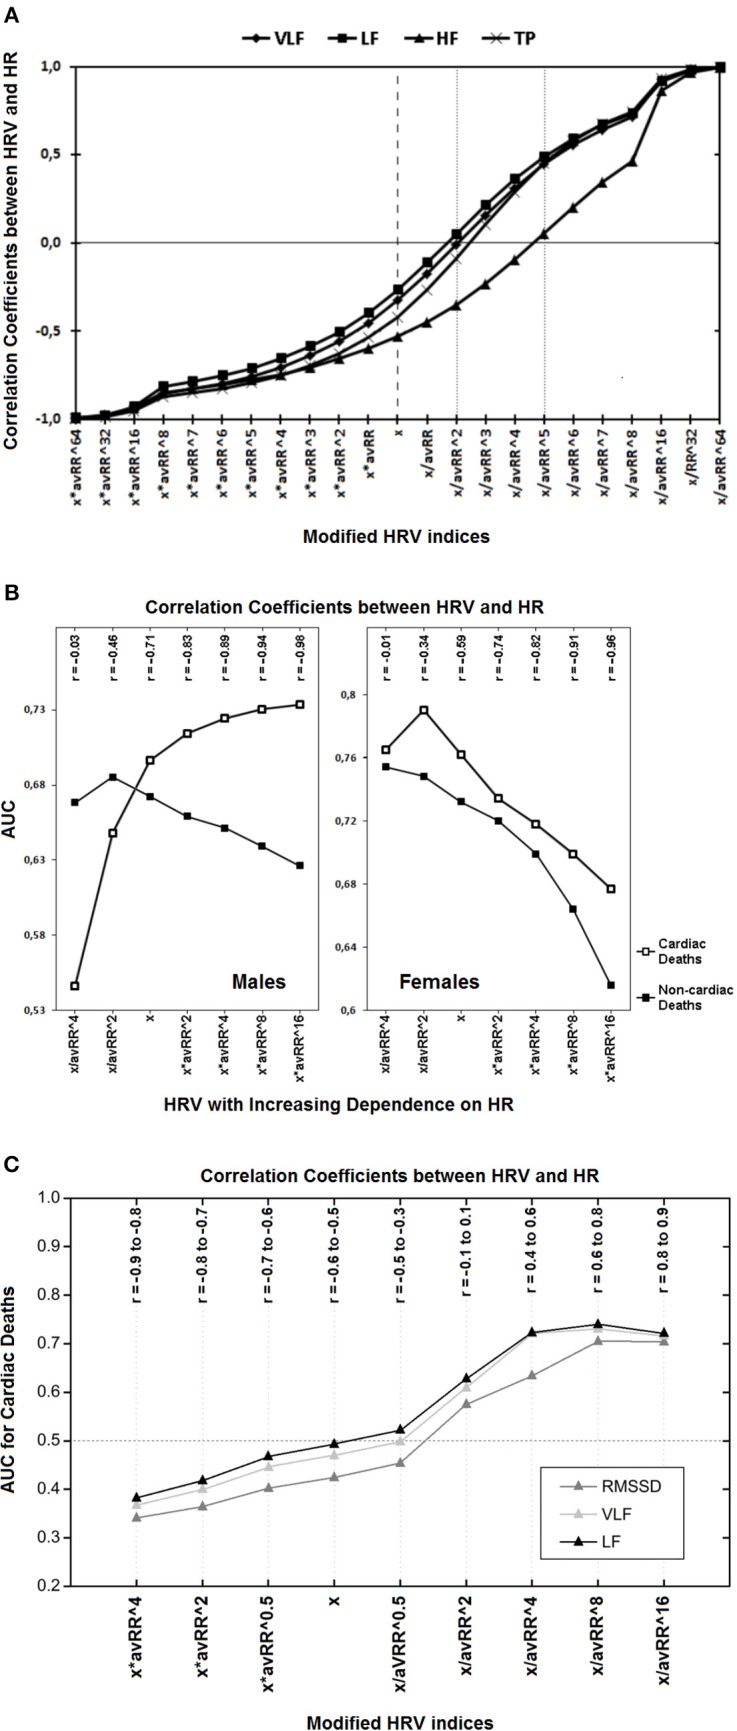
Figure 1.

(A) Correlation coefficients between different modified spectral HRV indices and HR are presented. The “x” denotes standard HRV indices which all are inversely associated with HR; multiplication by different powers of the corresponding average RR interval (avRR) increases this negative relationship (the left half of the diagram); but division by avRR to different powers diminishes the HRV dependence on HR and may even inverse this relationship, i.e., from negative to positive one (the right half of the diagram). Of note, to become HR-independent (i.e., to achieve insignificant correlation coefficients) VLF, LF and TP have to be divided by avRR∧2, but HF by avRR∧5 (see respective markers on dotted lines)—this is due to the fact that HF is initially more dependent on HR (compare respective markers on the dashed line). HF, high frequency component; LF, low frequency component; VLF, very low frequency component; TP, total power (Reprinted from Sacha et al., 2013b). (B) The prediction performance (i.e., AUC, area under receiver-operator characteristic curves) for different classes of modified HRV indices (i.e., very low frequency components of HRV spectrum) and their correlation coefficients (r) with HR in males and females are depicted. The “x” denotes standard HRV indices, other indices were calculated by division or multiplication of “x” by different powers of the corresponding average RR interval (avRR). In the first two classes (i.e., x/avRR∧4 and x/avR∧2), the HRV dependence on HR was weakened, while it was strengthened in the last four classes (i.e., x*avRR∧2, x*avRR∧4, x*avRR∧8 and x*avRR∧16). As HRV is becoming more dependent on HR (i.e., from the first to the seventh class), its predictive ability increases in men for cardiac death but decreases for non-cardiac one, while in women, it decreases for both outcomes. It is noteworthy that HR was a strong predictor of cardiac death and a weak predictor of non-cardiac death in males, however, in females HR did not predict any mode of death (Reprinted with modification from Sacha et al., 2014). (C) Predictive performance for cardiac mortality (i.e., AUC, area under receiver-operator characteristics curves) for different classes of modified HRV indices and their correlation coefficients (r) with HR, during the recovery after exercise test are presented. The “x” denotes standard HRV indices, other indices were calculated by multiplication or division of “x” by different powers of the corresponding average RR interval (avRR). The AUC < 0.5 indicates that higher HRV is related with worse prognosis but AUC > 0.5 means that higher HRV is associated with better prognosis. Standard HRV indices (i.e., x) are negatively correlated with HR and after multiplication by different powers of avRR this negative correlation becomes tighter, along with the improvement in their predictive ability (i.e., AUC is getting lower and lower)—of note, higher values of these indices are related with worse prognosis. However, the division by different powers of avRR makes HRV indices either independent on HR (i.e., x/avRR∧2) or positively correlated with HR (i.e., x/avRR∧4, x/avRR∧8 and x/avRR∧16) along with the increase in their predictive power—higher values of these indices are associated with better prognosis (i.e., AUC > 0.5). LF, low frequency component; RMSSD, root mean square successive differences; VLF, very low frequency component (Reprinted with modification and permission from Pradhapan et al., 2014).
