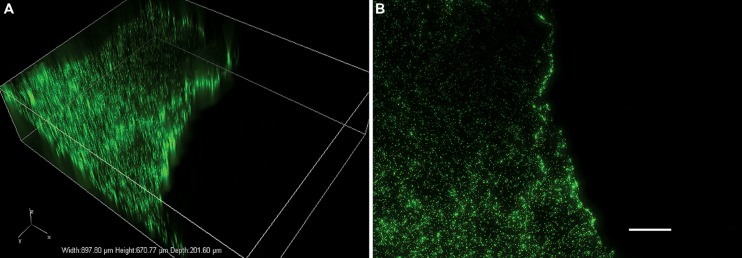
FIGURE 1.
Example of fluorescent microspheres (green dots) on shale showing contaminated and uncontaminated regions. The 2.5 by 4 cm shale was exposed to an aqueous solution containing 0.5 μm Fluoresbrite yellow-green microspheres (Polysciences Inc., Warrington, PA, USA) at a concentration of 3.64 × 10⁸ particles/mL. Images were obtained using a Nikon Eclipse Ti inverted microscope at 100x total magnification (10x objective) and NIS Elements v. 4.00.07 software. Image (A) shows a volumetric composite of captured Z-stack images over a depth of 201.60 μm; image (B) shows the same data as a composite maximum-intensity projection. Scale bar = 100 μm.

