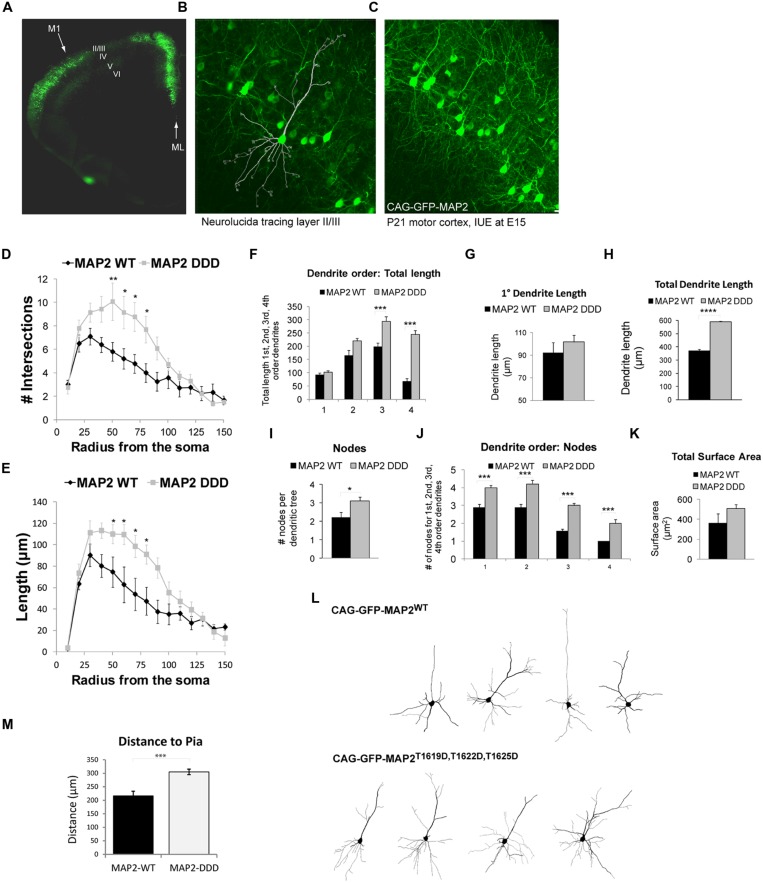
FIGURE 4.
MAP2T1619D,T1622D,T1625D regulates basal dendrite architecture in vivo. (A) Mice electroporated with DNA at E15 in utero were sacrificed at postnatal day 21. The fluorescent micrograph of a cerebral hemisphere shows expression of GFP in L2/3 of Motor cortex 1 (M1). The midline (ML) is indicated. (B,C) Higher magnification confocal micrographs of L2/3 depicting the neurolucida tracing (B) and the dense network of GFP-expressing cells (C). (D,E) The number of intersections (D) and dendrite length (E) from Sholl analysis of whole cell basal dendrites from mice electroporated in utero with pEGFP-CAG-MAP2T1619D,T1622D,T1625D revealed increased dendrite complexity compared to mice expressing pEGFP-CAG-MAP2WT. (F) There was a significant increase in dendrite length in third and fourth order branches. (G) Primary dendrite length however remained unchanged. (H) There was a significant increase in total dendrite length in MAP2T1619D,T1622D,T1625D expressing mice. (I) The average number of nodes per dendritic tree was increased in Jnk1-/- mice. (J) The number of nodes was significantly increased at every dendrite order. (K) The surface area measurements from neurons in GFP-MAP2WT or GFP-MAP2T1619D,T1622D,T1625D expressing mice are shown. (L) Representative Sholl traces from mice expressing GFP-MAP2WT or GFP-MAP2T1619D,T1622D,T1625D are shown. Statistical analysis in (D–F,J) were two-way ANOVA with post hoc Bonferroni test of significance for individual points. *p < 0.05; **p< 0.01; ***p< 0.005. (G–I,K,M) were analyzed by Student’s t-test. *p< 0.05; ***p< 0.001; ****p< 0.0001. Twenty-four dendritic trees were analyzed from four separate mice. (Ten from WT and 14 from GFP-T1619D,T1622D,T1625D–expressing mice. (M) The distance from the pia of neurons expressing GFP-MAP2WT or GFP-MAP2T1619D,T1622D,T1625D is indicated. Neurons expressing GFP-MAP2T1619D,T1622D,T1625D remained further from the pial surface in 21d mice.

