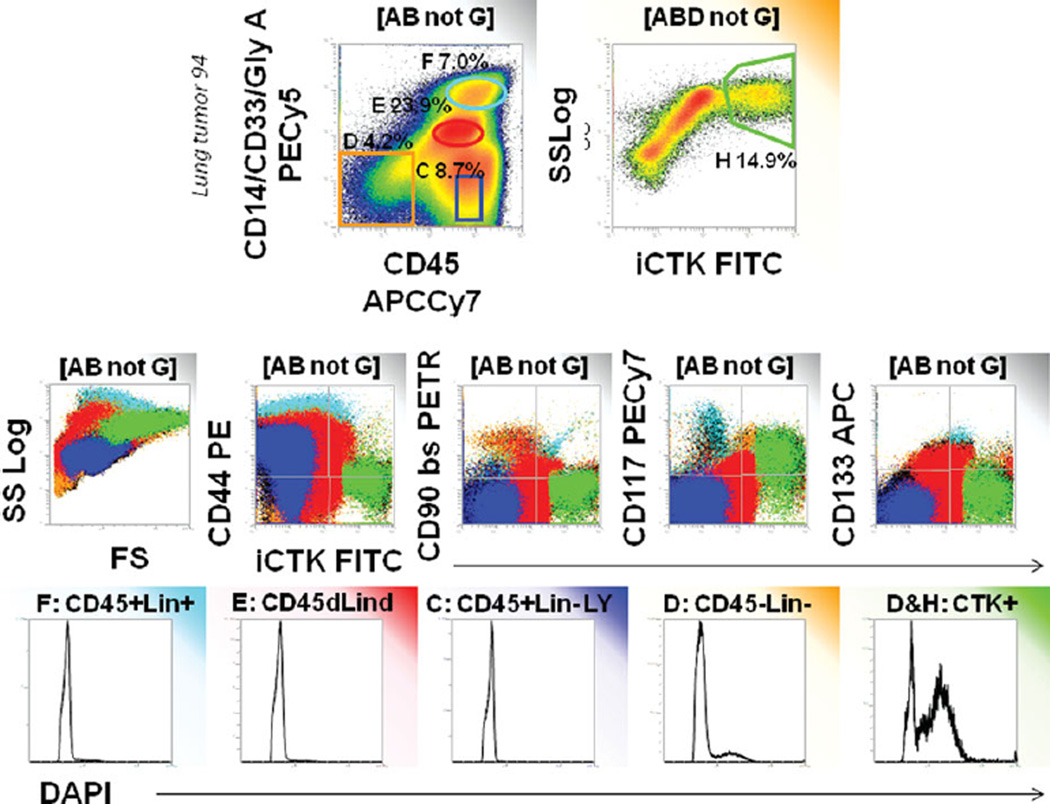
Figure 3.
Characteristics of populations eliminated by CD45/heme lineage dump gate. Color-eventing is used to trace four major populations observed in the CD45 by heme lineage histogram. All events are gated as described in Figure 1 The majority of aneuploid cells are contained within the nonhematopoietic gate used as a first step in analysis (D, orange). Aneuploid cells are further concentrated when events within D are further gated on cytokeratin+. Lymphocytes (C, blue) are predictably cytokeratin negative, diploid, CD44+ and negative for stem/progenitor markers. Monocytes (E, red) are diploid and appear to be cytokeratin dim to bright, but isotype controls reveal the dim population to be negative (not shown). Cytokeratin bright monocytes have cytokeratin+ cytoplasmic inclusions (Supporting Information Fig. S1). Granulocytes and mast cells (F, turquoise). Granulocytes are diploid, autofluorescent, and negative for cytokeratin and stem/ progenitor markers. Mast cells are CD117+ and CD44+.

