
FIG. 1.
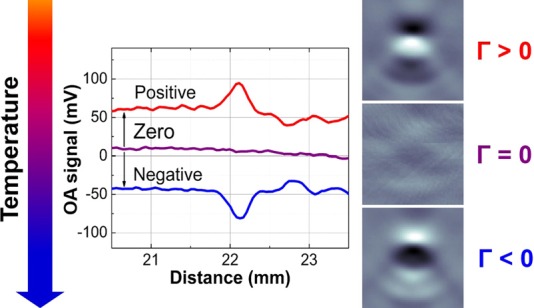
Transition through the temperature of zero optoacoustic response visualized in blood samples. Processed optoacoustic signals (central graph) and reconstructed 3 × 3 mm2 images (right panel) illustrate change of the polarity in optoacoustic response observed during cooling of blood samples at the temperature where Grüneisen parameter Γ = 0. “Positive” and “negative” optoacoustic signals are shown offset by ±50 mV for illustrative purposes.