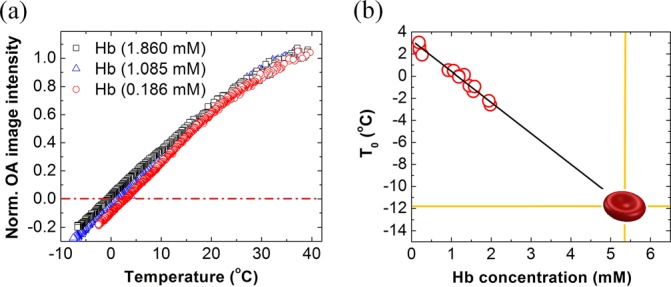
FIG. 3.

(a) Optoacoustic image intensity normalized at 37 °C as a function of temperature for three different concentrations of hemoglobin. Dashed dotted line marks zero optoacoustic response. (b) Temperature T0 of zero optoacoustic response as a function of hemoglobin concentration. Linear fit results in equation: T0 = −2.8·[Hb] + 3.1, where [Hb] is the molar concentration of hemoglobin. The fit line intercepts the ordinate at about 3 °C, which represents the properties of used PBS solvent (see supplementary material45 for experimental proof). Extrapolation of the fit function to the typical concentration of hemoglobin inside red blood cells [Hb] ≈ 5.3 mM results in T0 = −11.7 °C, which is close to the experimentally measured value of −12.8 °C.
