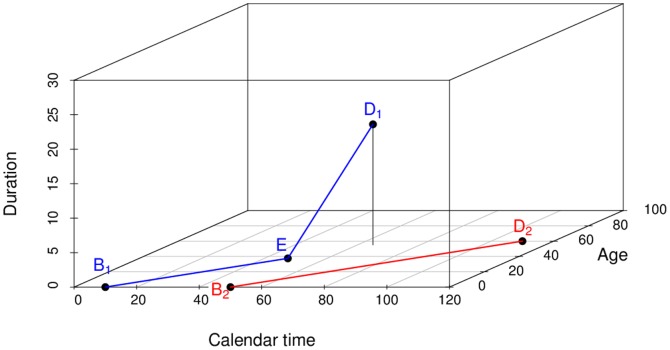
Figure 2. Three-dimensional Lexis diagram with two life lines.
Abscissa, ordinate and applicate (z-axis) represent calendar time  , age
, age  and duration
  , respectively. The life lines start at birth
  and end at death
  The first subject (blue line segments) contracts the disease at
  . Then, the life line changes its direction. The second subject (red line segment) does not contract the disease, the life line remains in the t-a-plane.

