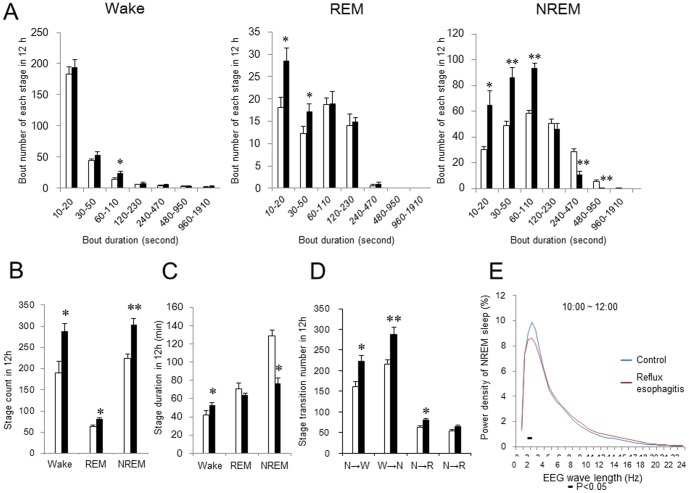
Figure 4. Effect of reflux esophagitis on sleep fragmentation and stage transitions.
(A) Number of stage bouts in the 12-h light period. (B) Number of stage counts in the 12-h light period. (C) Duration of each sleep stage in the 12-h light period. (D) Stage transitions during the 12-h light period. NREM, non-rapid eye movement; REM, rapid eye movement. (E) Relative average EEG power density of NREM sleep between 10:00 a.m. and 12:00 a.m. The horizontal bars indicate statistical difference (p<0.05) between control and reflux esophagitis group. N = 8. Data are mean ± SEM. White bars represented control rats and black bars represented reflux esophagitis rats. *p<0.05 versus control. **p<0.01 versus control.

