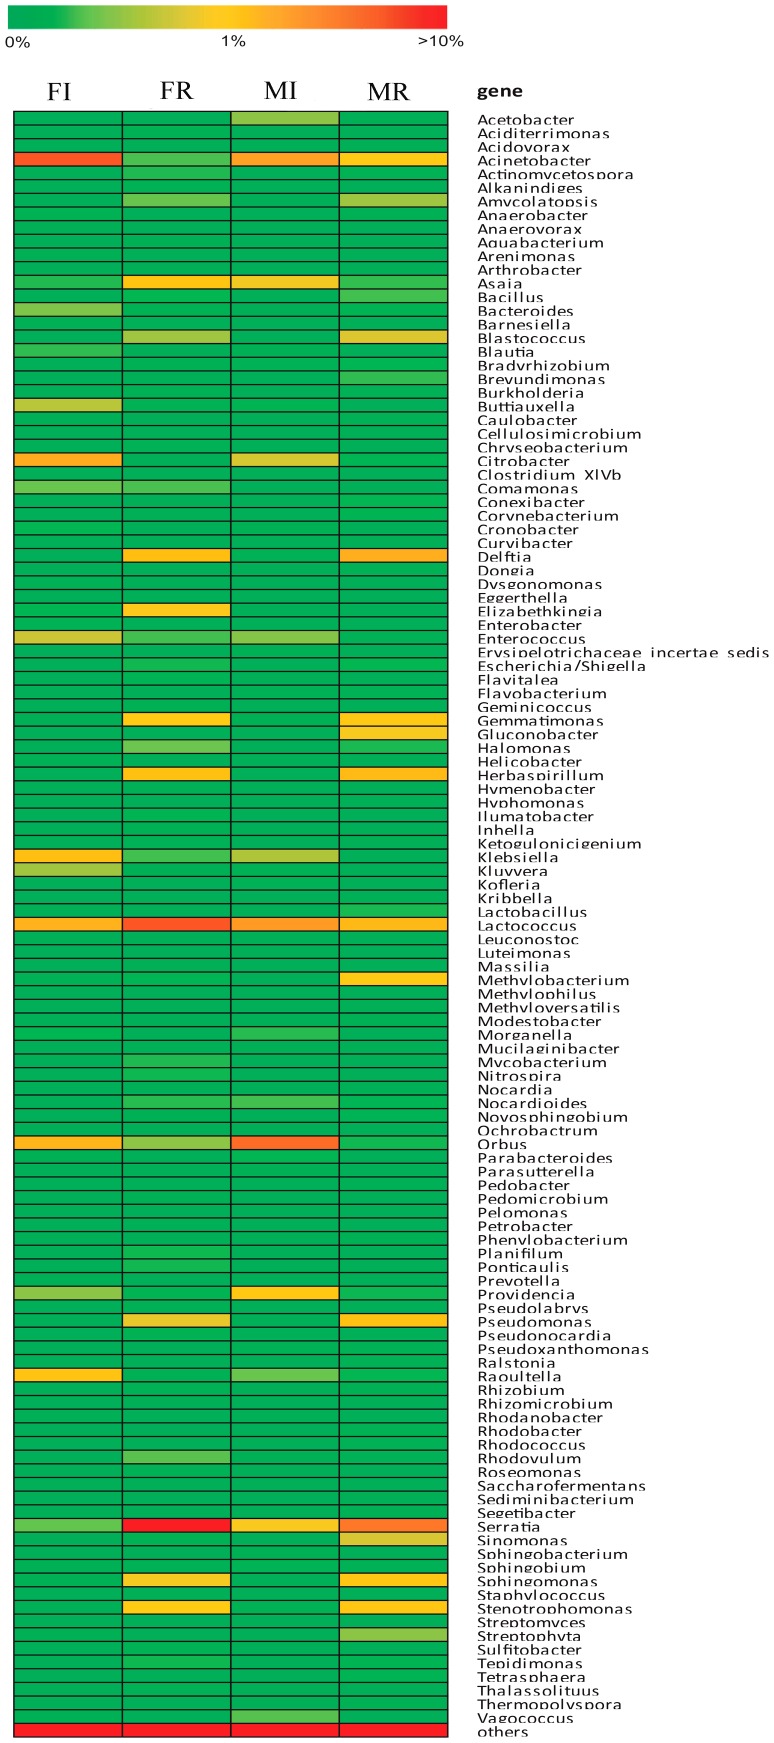
Figure 3. Heatmap showing the relative abundance and distribution of 16S rRNA tag sequences assigned into selected clusters.
The color code indicates relative abundance, ranging from green (low abundance) to yellow to red (high abundance). Abbreviations: FI, female-intestine; FR, female-ovary; MI, male-intestine; MR, male-testis.

