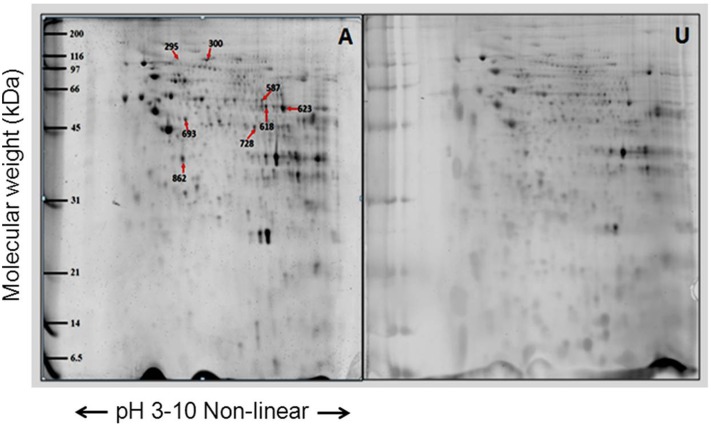
Figure 5. Representative proteome map of differentially expressed proteins from the mitochondrial fractions of fibroblasts from (A) LHON cases (n = 7) and (U) unaffected LHON individuals (n = 3).
Equal amounts of proteins (100 µg) from each sample were resolved by 2-DE. The numbers indicate the spot IDs of proteins whose expression levels differ significantly between the LHON cases and their unaffected relatives.

