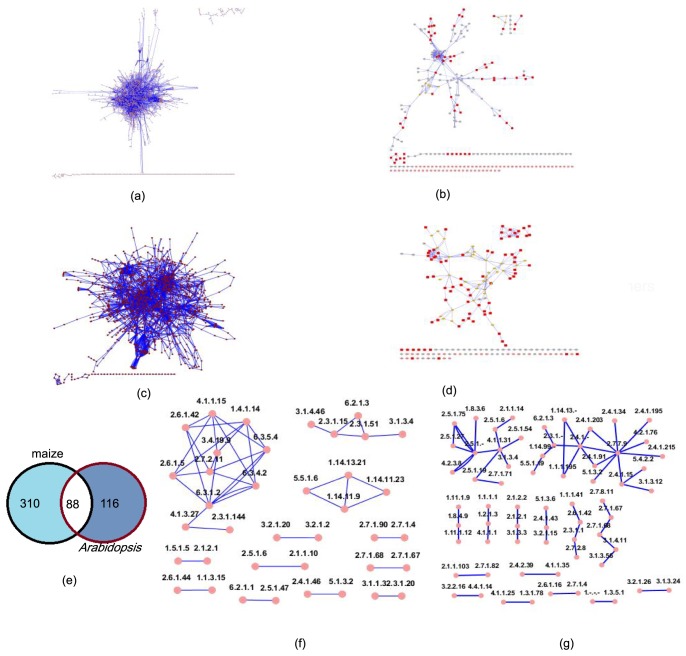
Figure 3. Sub-network of GECN.
(a) Full GECN model of maize silk. SIF Cytoscape formation in Data S2. (b)Sub-interaction network of maize silk. .xlse file in Data S5. (c) Full GECN model of Arabidopsis. SIF Cytoscape formation in Data S1. (d) Sub-interaction network of Arabidopsis pistil. .xlse file in Data S5. (e) Distribution of enzymes in maize and Arabidopsis pistil. .xlse file in Data S3. (f) Overlap structure of GECN models of maize and Arabidopsis. .xlse file in Data S3 . (g) Distribution of enzymes of Arabidopsis pollen tube in response to pollination. .xlse file in Data S3 and Data S5. Connected pairs of nodes analyzed by NetworkAnalyzer were marked by red. Graph was generated with the Cytoscape software [75].

