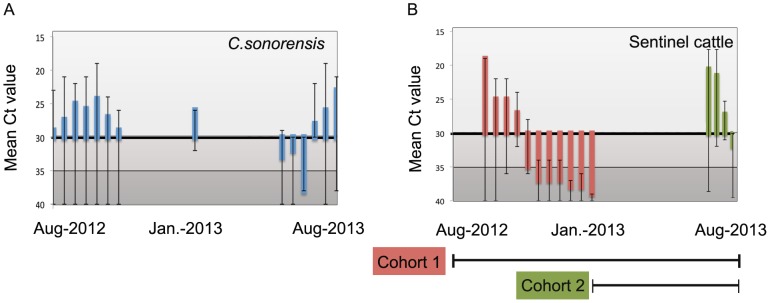
Figure 2. Seasonal detection of BTV RNA among parous female C. sonorensis midges; blue histogram represent mean cycle threshold (Ct) values obtained from qRT-PCR assays.

Panel A. Seasonal detection of BTV RNA among sentinel cattle enrolled in two cohorts; Panel B. Cattle in cohort 1 (red histogram) were enrolled during the seasonal period of infection and monitored throughout the year (July, 2012-August, 2013) while cattle in cohort 2 (green histogram) were enrolled during the interseasonal period and monitored throughout the season (January 2013-August, 2013). In each figure, the scale on the y-axis is inverted where 15 represents the upper limit and 40 the lower limit and error bars are indicative of the maximum and minimum Ct values for each date. The solid line indicates the threshold for interpretation of a positive result (light grey; Ct range 15–30). Below the black line, Ct results are interpreted as indeterminant (medium grey; Ct range 30–35) and negative (dark grey; Ct range 36–40).
