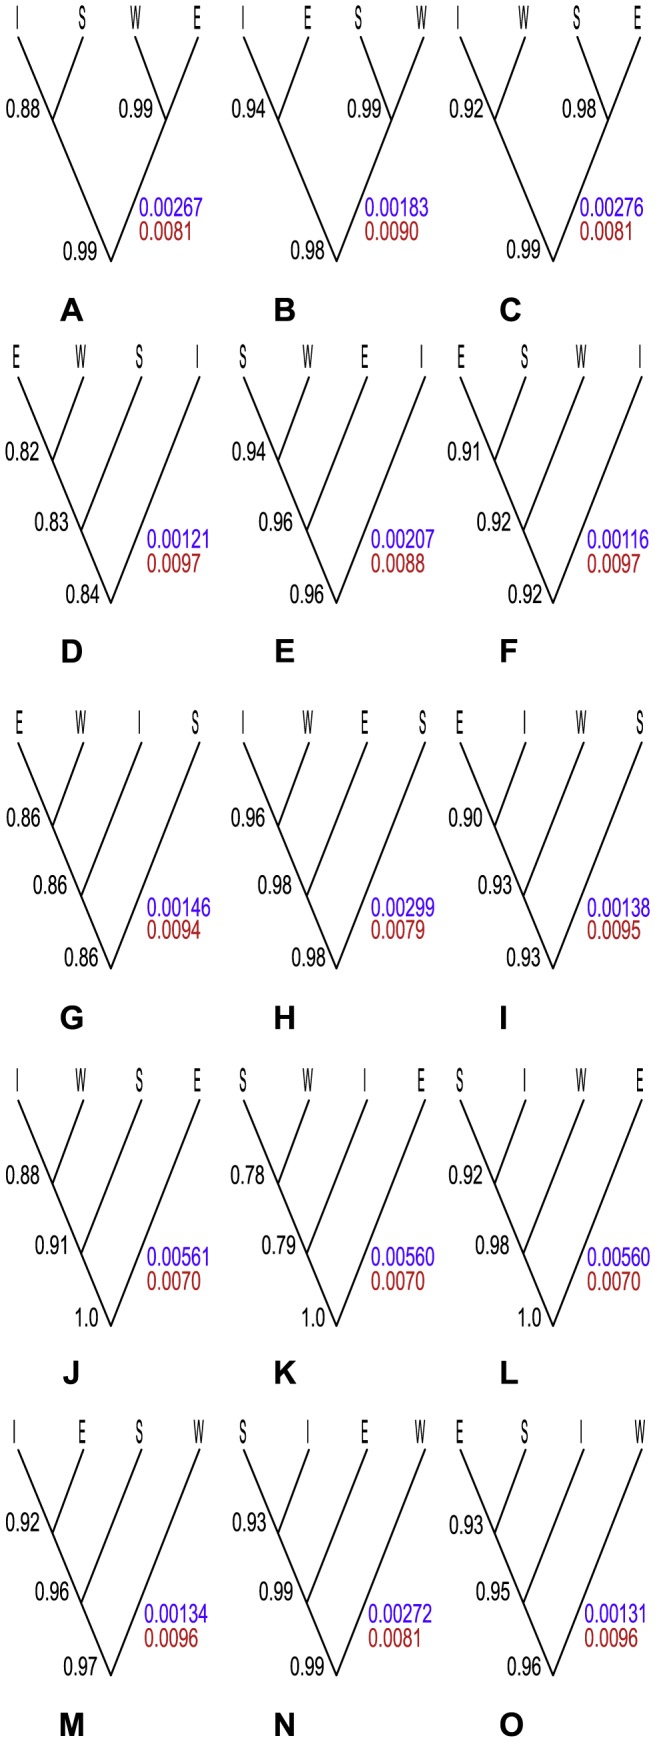
Figure 2. Results of 15 guide trees evaluated with BP&P. A–O.

Numbers to the left of the nodes are the means of posterior probability values for speciation in that particular node observed from three replicate analyses. Colorful numbers to the right of each tree are mean values from the three separate runs for the root height (purple) and effective population size (red) of that particular tree. Tip abbreviations correspond to S. ertekinii (E), S. cryptoneura (W), S. salamandra (S), and S. insularis (I).
