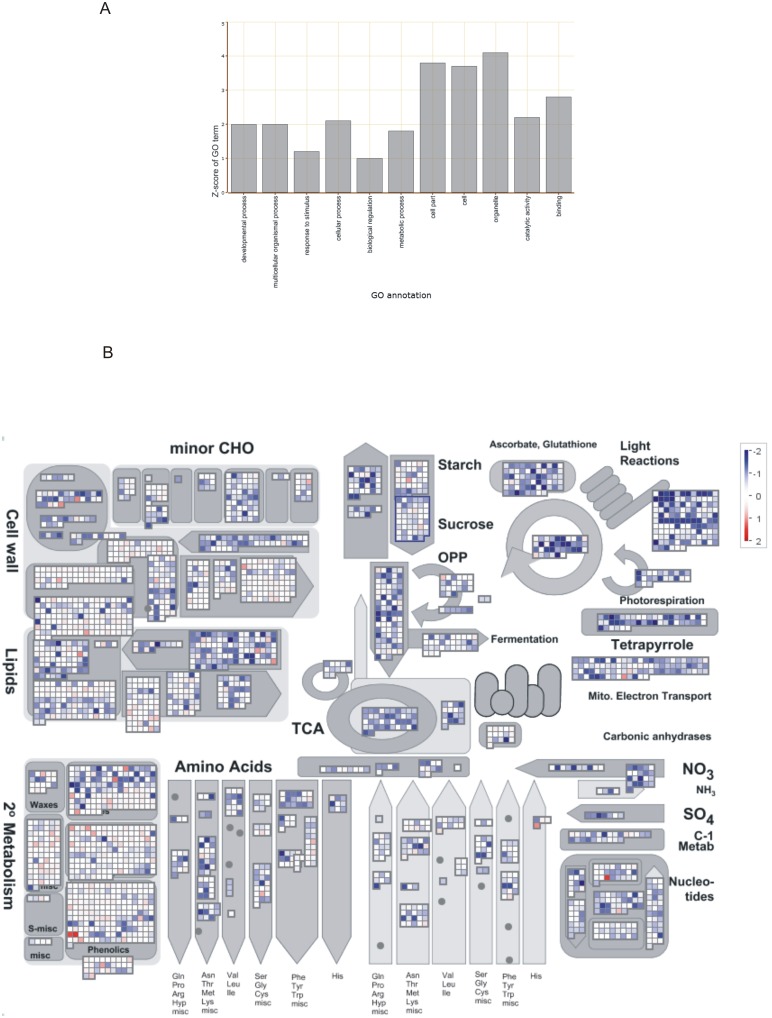
Figure 1. Visualization of transcriptome data of shoots of rice infected with rice root nematode Hirschmanniella oryzae.
(A) Parametric Analysis of Gene Set Enrichment of the differentially expressed genes in the shoots of infected versus uninfected plants. The Z-scores of the significantly enriched secondary level GO terms are shown. (B) Mapman visualization of the expression profiles of genes involved in the general metabolism of the rice plant. The visualization shows the observed differential expression patterns, based on the Log2 fold changes of mRNA levels, in shoots of infected versus uninfected control plants. Red dots indicate that the gene is upregulated in infected plants versus the corresponding healthy control plants, while blue indicates downregulation.

