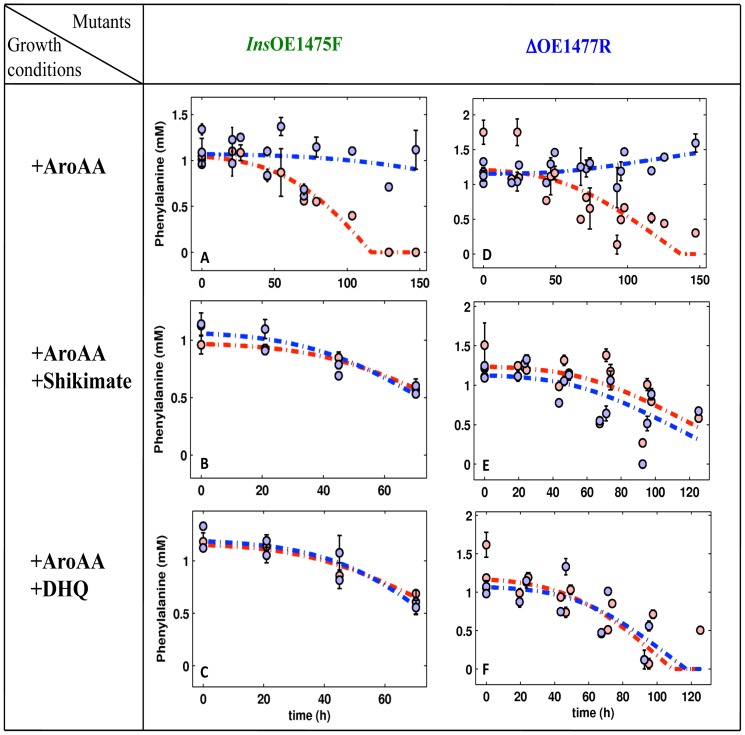
Figure 8. Phe consumption during the growth of WT and mutants InsOE1475F (left panel) ΔOE1477R (right panel).
Culture media were supplemented with AroAAs, DHQ or shikimate, as indicated in the growth conditions column at left (see Methods for details). In each graph, the red circles represent Phe consumption by WT H. salinarum and blue circles represent consumption by the mutant strain. Simulation curves (dashed lines), are red for WT, and blue for the mutants. Error bars show the deviation of the average calculated from three biological repeats and two technical repeats. The uptake rates were calculated from the corresponding simulations.

