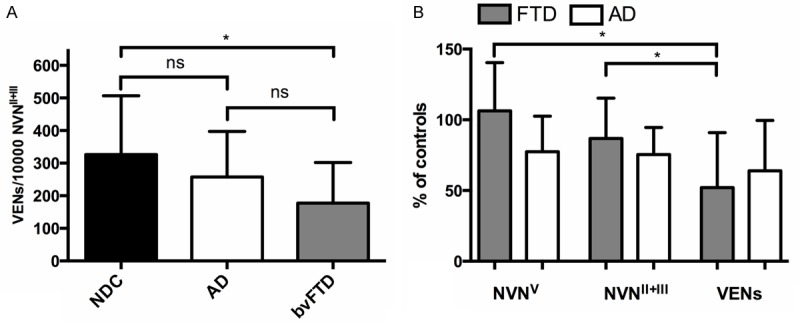
Figure 2.

A. Comparison between von Economo neurons (VENs) per 10.000 non- VEN-neurons (NVN) in cortical layers II and III, in non-demented controls (NDC), cases with Alzheimer’s disease (AD), and behavioral variant frontotemporal dementia (bvFTD). B. Densities NVN of layer V (NVNV), of layer II and III (NVNII+III), and of VENs, expressed as percentage of controls, in cases with FTD and AD. Bars represent mean and error bars one standard deviation. *=significant at p<0.05, ns=not significant.
