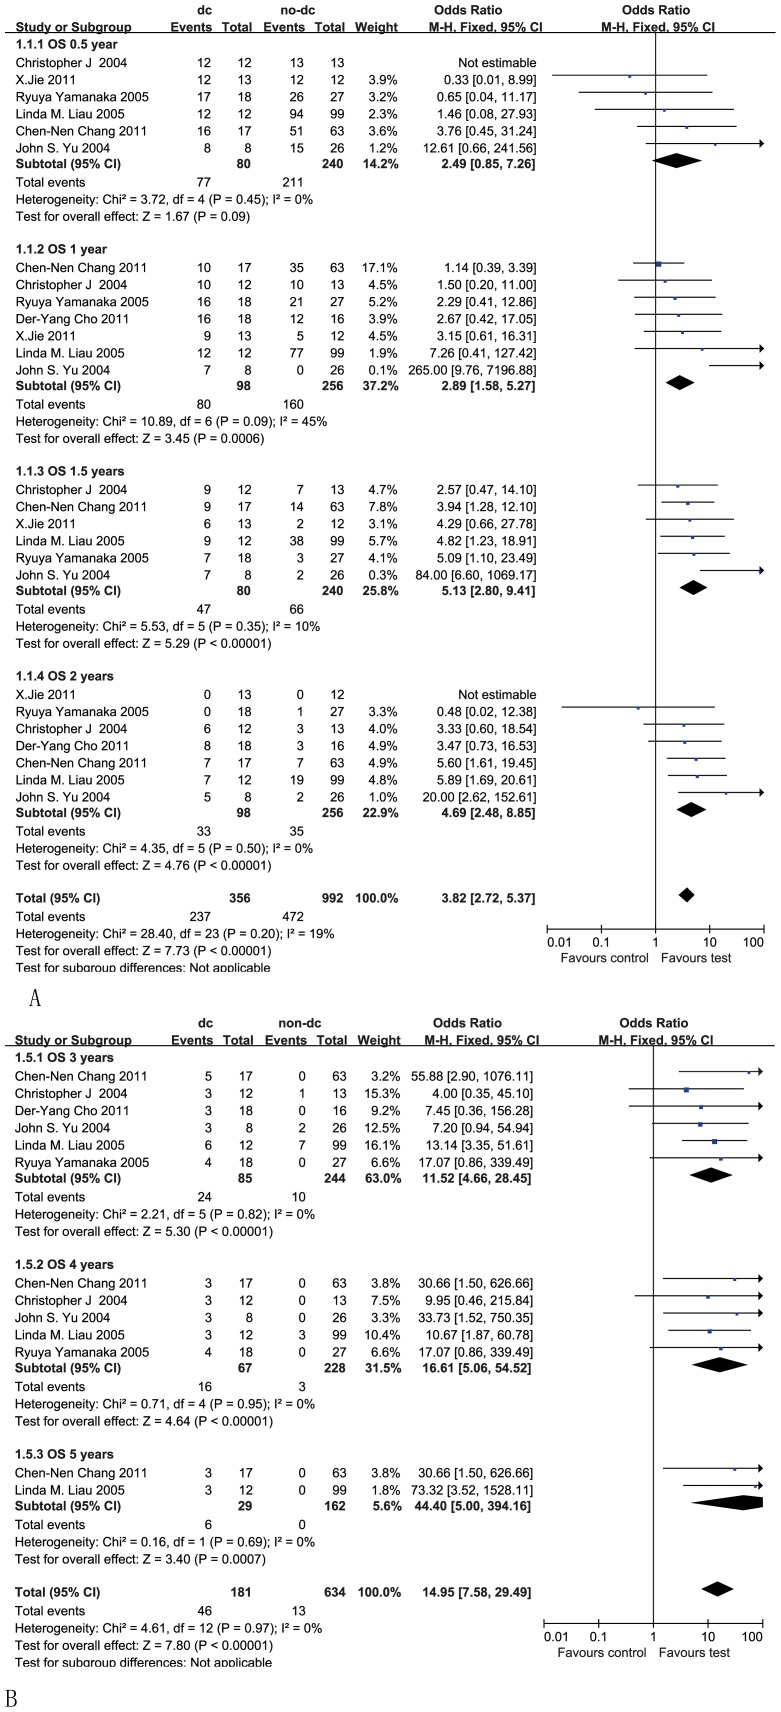
Figure 2. Comparison of 0.5-, 1-, 1.5- and 2-year overall survival (OS) between the non-DC and DC groups (A); Forest plot for 3-, 4-, and 5-year OS between the non-DC and DC groups in HGG patients (B).
The fixed-effects meta-analysis model (Mantel-Haenszel method) was used. OR, odds ratio. DC, DC-containing therapy; non-DC, non-DC-containing therapy. Each trial is represented by a square, the center of which gives the odds ratio for that trial. The size of the square is proportional to the information in that trial. The ends of the horizontal bars denote a 95% CI. The black diamond gives the overall odds ratio for the combined results of all trials.

