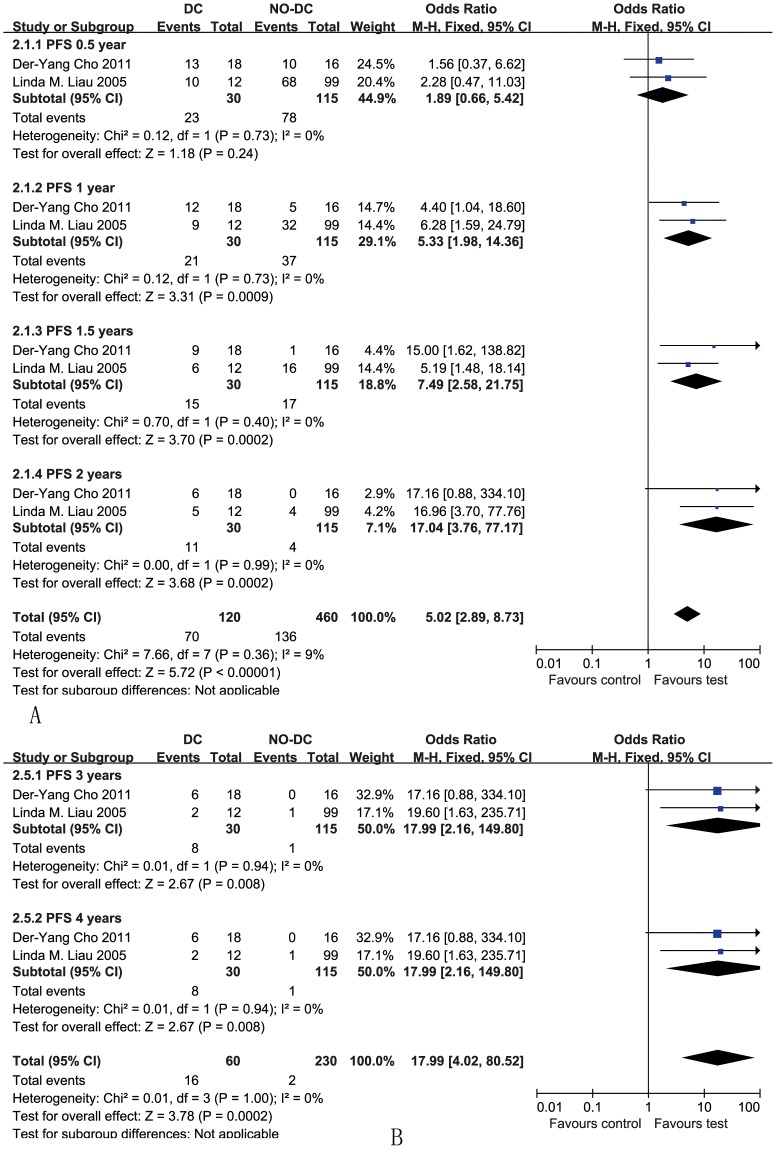
Figure 3. Comparison of 0.5-, 1-, 1.5-, and 2-year progression-free survival (PFS) between the non-DC and DC groups (A); Forest plot for 3-, 4-, and 5-year PFS between the non-DC and DC groups in HGG patients (B).
The fixed effects meta-analysis model (Mantel-Haenszel method) was used in this analysis.

