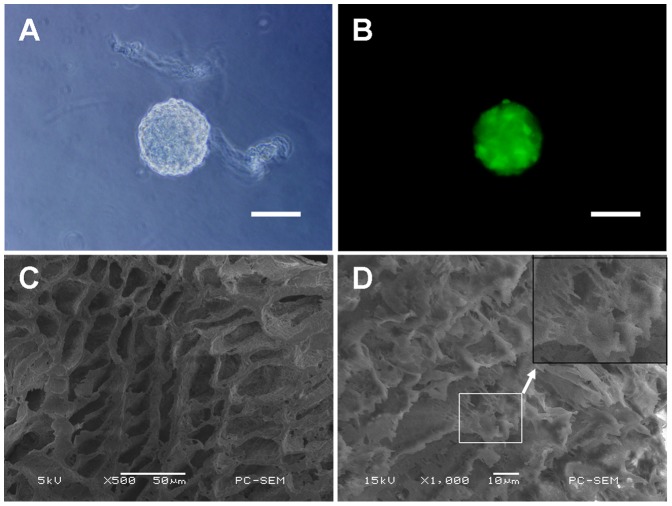
Figure 1. Neurosphere and PCLA scaffold.
(A) A neurosphere visualized under a light microscope. (B) GFP-positive neurosphere visualized under a fluorescent microscope. (C) SEM images of the inner wall of the PCLA conduit without NSCs. (D) NSCs adhered to the inner wall of the PCLA conduit. The black box show representative cells from the white box at higher magnification to enhance visualization of cellular morphology under SEM. Scale bars = 100 µm in A–B, 50 µm in C, and 10 µm in D.

