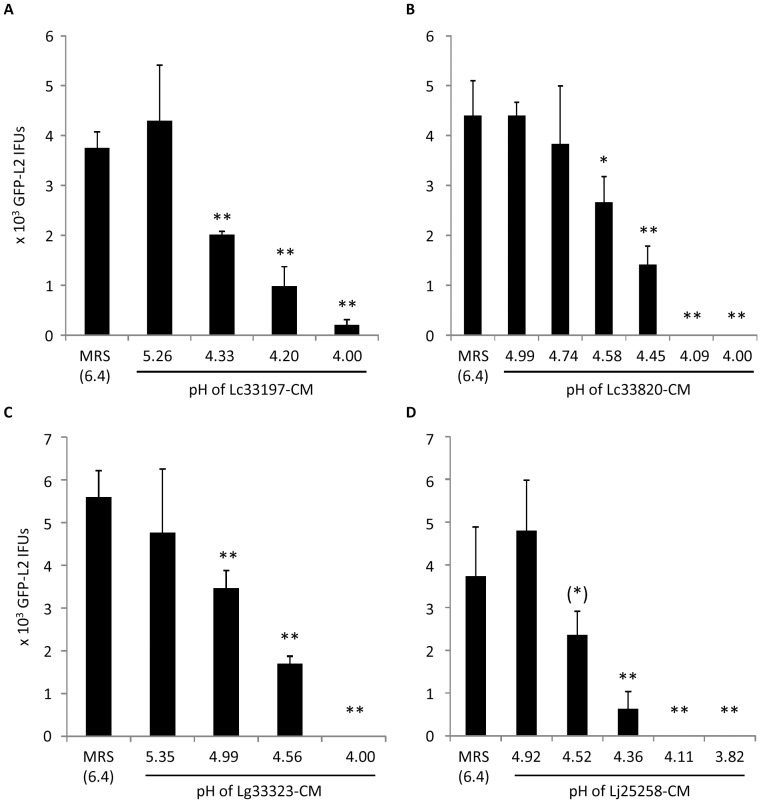
Figure 2. Effects of LCM longitudinally collected from still cultures of Lc33197 (A), Lc33820 (B), Lg33323 (C) and Lj25258 (D).
pH values of LCM are shown on the horizontal axis. GFP-L2 EBs were treated for 1 h. Surviving bacteria were quantified as outlined in Fig. 1 legend. Values were averages ± standard deviations of triplicate experiments. Single and double asterisks above LCM-treated samples denote statistically decreased IFUs (P<0.05 and P<0.01, respectively) as compared to control MRS Lactobacillus medium-treated samples. The parenthetic asterisk indicates statistically decreased IFUs in samples treated with LCM (pH 4.52), as compared to IFUs that survived the treatment with LCM (pH 4.92), although the P value between control MRS (pH 6.4) and MRS (pH 4.52) was 0.068.

