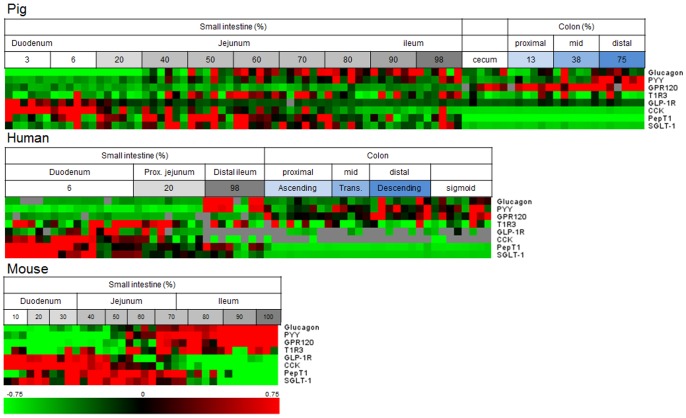
Figure 2. Heatmap of pig, human and murine gene expression results.
Horizontally the individual samples of different parts of the intestine are aligned from proximal to distal and vertically the eight genes are shown. Green and red indicate low and high gene expression compared to average, respectively. Grey indicates samples that could not be analyzed/detected.

