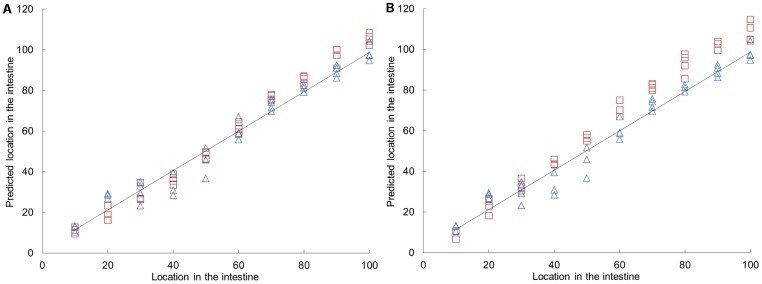
Figure 3. PLS prediction of locations along the intestine based on the gene expression in a sample.
The PLS prediction model used 3 factors and has an R2 = 0.9681. The samples of mice fed a chow diet (Δ) were the basis of the model and the data of mice fed a low-fat (A, indicated with □) and high-fat diet (B, indicated with □) was fitted in the model.

