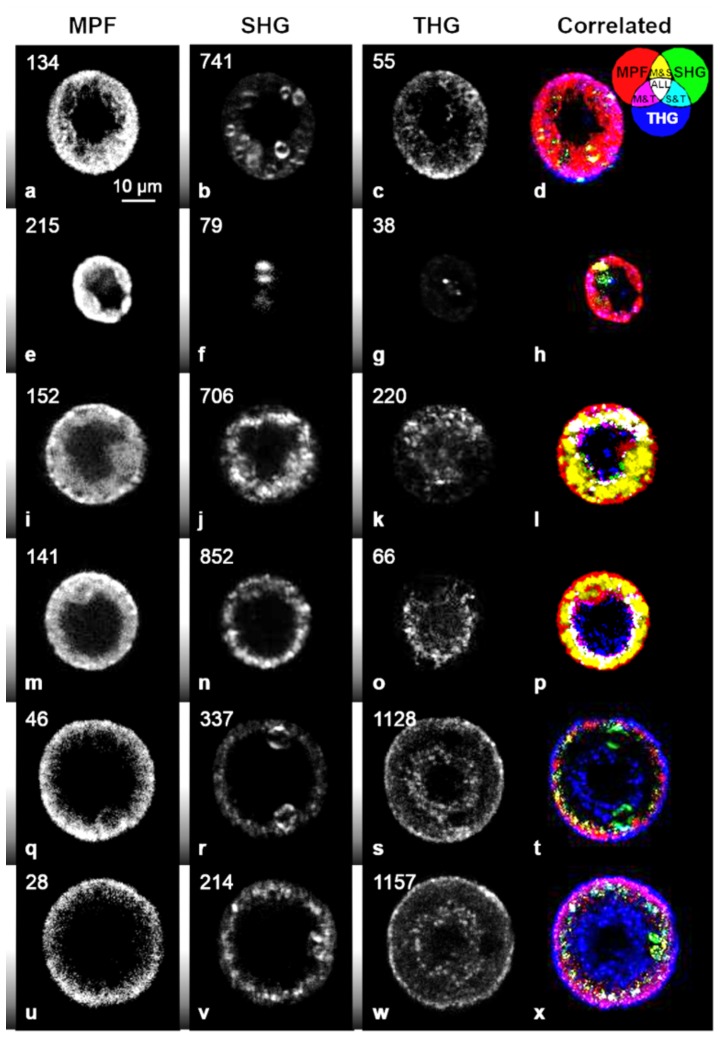
Figure 2. Nonlinear optical microscopy images of Haematococcus pluvialis at varying stages of light-stress.
(a through h) palmella non-induced cells, (i through p) palmella induced cells and (q through x) aplanospores visualized by (a, e, i, m, q, u) MPF, (b, f, j, n, r, v) SHG, (c, g, k, o, s) THG and (d, h, l, p, t, x) structural image cross-correlation analysis between MPF, SHG and THG [16]. The numbers in the upper left corner indicate the maximum photon counts in a pixel and the grey scale bar on the left side of the image ranges from zero to the maximum signal intensity. In general, a large THG intensity difference is seen between green-colored palmella non-induced cells and red aplanospores where, for example, the red aplanospore (s) is about 20 times more intense than the green-colored palmella non-induced cell (c) due to increased concentration of astaxanthin.

