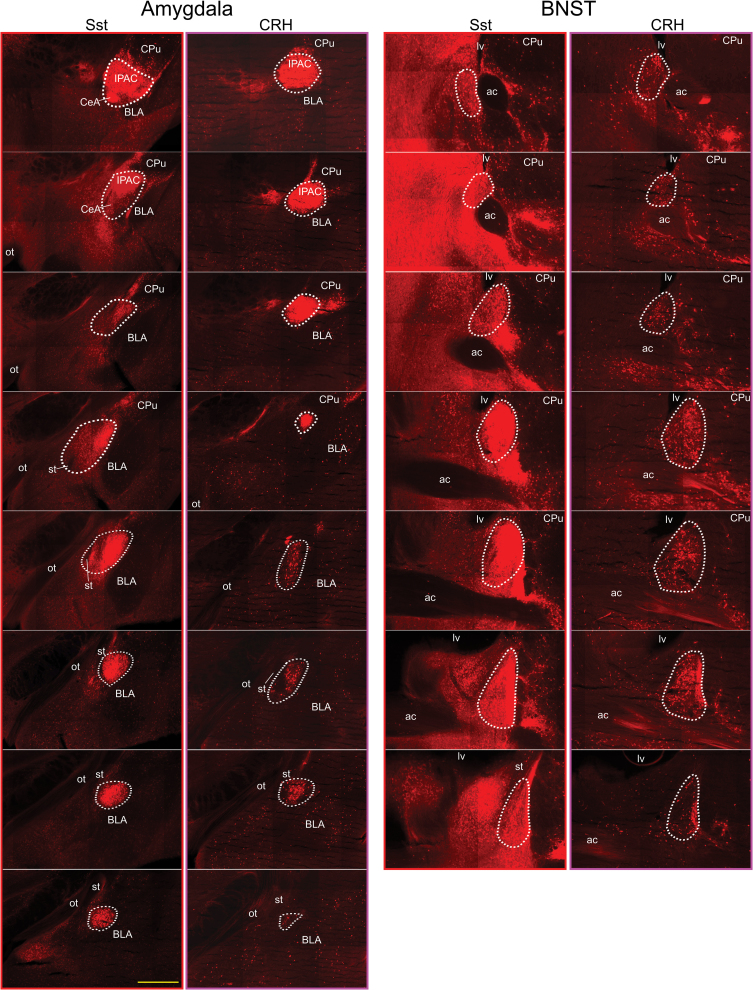
Figure 3.
Fluorescent montage images (×10) showing TdTomato expression in the amygdala (left panels) and BNST (right panels) of an Sst/TdTomato mouse and Crh/TdTomato mouse. Tissue sections are arranged from anterior (top) to posterior (bottom) and correspond to the levels from which cell counts were obtained. Medial is to the left and dorsal to the top. The core of fluorescent reporter expression within the CeA and BNST is outlined with white dots. ac, anterior commissure; BLA, basolateral nucleus of the amygdala; CPu, caudate/putamen; IPAC, interstitial nucleus of the posterior limb of the anterior commissure; lv, lateral ventricle; ot, optic tract; st, stria terminalis. Scale bar equals 500 µm.

