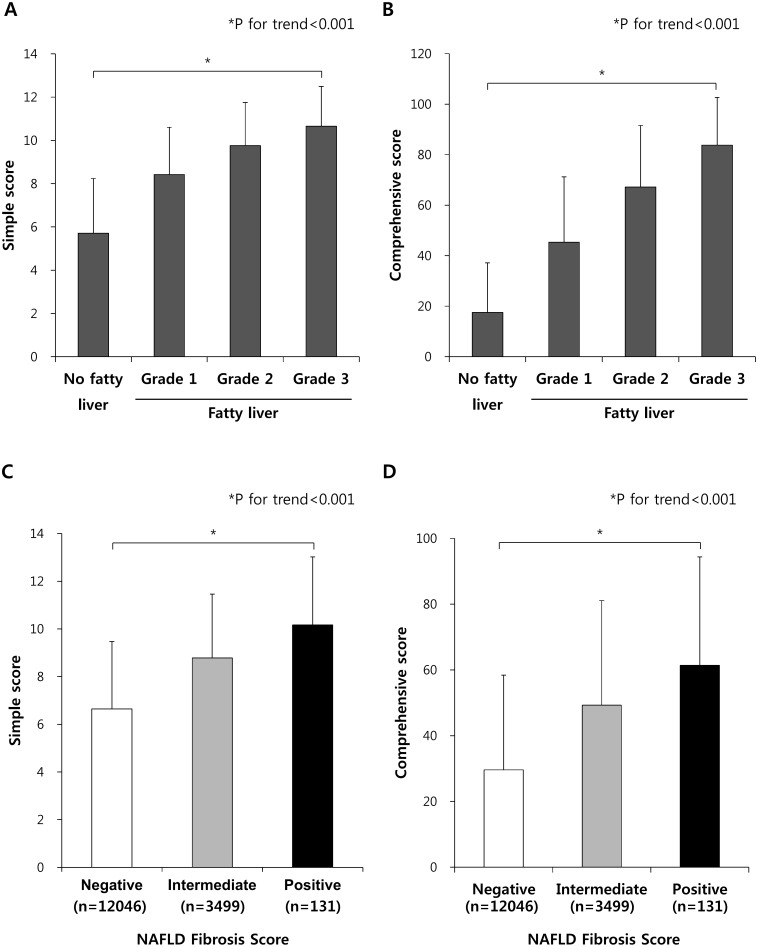
Figure 3. Average scores for the simple and comprehensive models according to fatty liver grade determined by hepatic ultrasound or NAFLD fibrosis score.
Average scores for A) the simple model or B) the comprehensive model according to fatty liver grade determined by hepatic ultrasound. All P values of comparison between any groups are <0.001. *P for trend are <0.001. Average scores for C) the simple model or D) the comprehensive model according to the fatty liver conditions defined by NAFLD fibrosis score. Subjects with negative results by NAFLD fibrosis score (N = 12046) could be excluded from having advanced fibrosis and subjects with positive results of NAFLD fibrosis score (N = 131) are highly likely to have advanced fibrosis. All P values of comparison between any groups are <0.001. *P for trend are <0.001. Data are shown as mean with SD.

