
Figure 4.
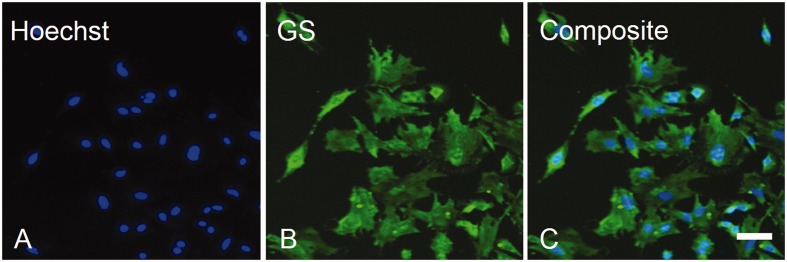
Expression of GS by isolated SGCs in culture. In order to confirm the establishment of SGC-enriched cultures, an anti-GS antibody (B) was employed, showing that virtually all cells were GS positive (C). Magnification = 100× (A–C). Scale bar = 50 µm. GS, Glutamine synthetase; SGCs, satellite glial cells.