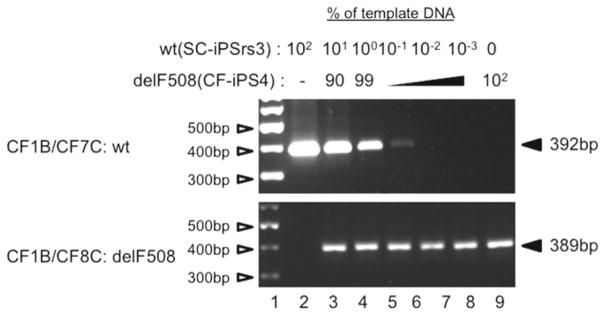
Fig. 2.

AS-PCR titration analysis for sensitivity of detection. PCR control titration analysis involves the mixing genomic DNA from a nonCF-iPS cell line (SC-iPSrs3) with CF1-iPS4 at varying proportions. The products from the AS-PCR amplification with primer pair CF1B/CF7C (wt) or pair CF1B/CF8C (delF508) are electrophoretically separated on a 2 % agarose gel and visualized by ethidium bromide staining. The intensity of the band represents the proportion of the wtCFTR DNA present within each mixture and reflects the sensitivity of the AS-PCR assay. The marker DNA (Lane 1 ) was the GeneRuler 100 bp plus DNA ladder (Thermo Fisher Scientific, Waltham, MA)
