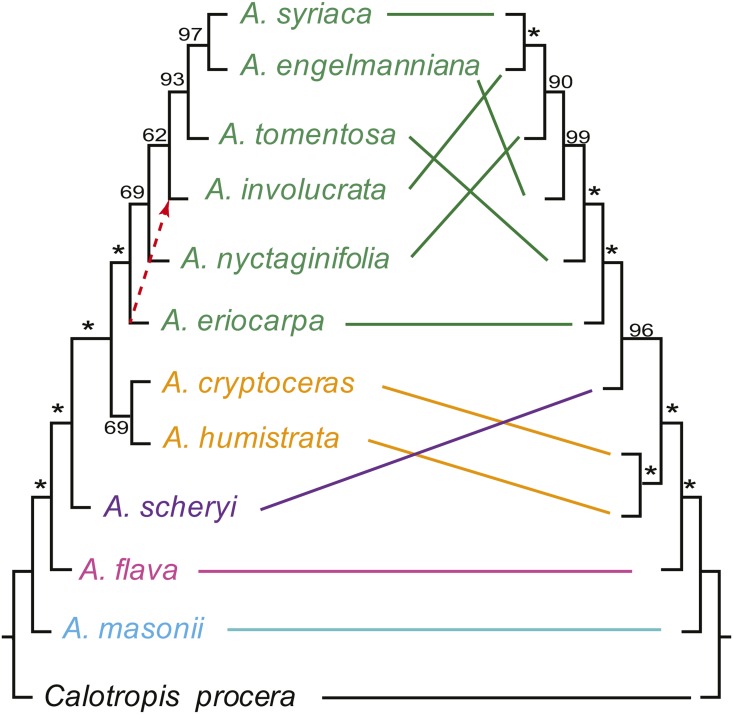
Fig. 2.
Comparison of the species tree of Asclepias based on 761 putatively single-copy loci and the whole plastome phylogeny. The MP-EST tree is shown at left, and the difference between this topology and that recovered through an analysis of the concatenated nuclear gene data set is indicated by the red arrow. Solid lines connect each species to its placement in the plastome phylogeny (right). Values near the branches are bootstrap support values (* = 100%). Colors reflect the plastid clades of Fishbein et al. (2011): temperate North America (green), unplaced (orange), highland Mexico (purple), series Incarnatae sensu Fishbein (pink), Sonoran Desert (blue), and outgroup (black).

