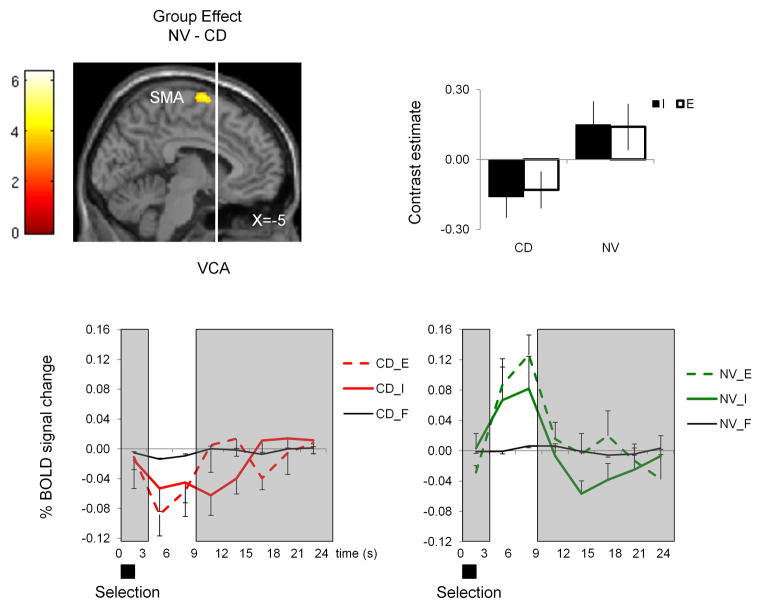
Figure 2. Group effect.
The SPM image represents the Group effect of the mixed measures ANOVA comparing internally generated versus fixation (I–F) and externally generated versus fixation (E–F) as within-subject factors and conversion disorder patients (CD) and normal subjects (NV) as between-subject factors. The SPM image shows decreased activity of the left supplementary motor area (SMA) in CD patients relative to NV during I-E. The contrast estimate and time course analysis for I and E in CD patients and NV are also shown for the left SMA. The time course analysis using the Finite Impulse Response function of MarsBar (marsbar.sourceforge.net) was time-locked to the two-second cue and the areas in white indicate the cue-related peak hemodynamic response function. The SPM image is shown at P<0.001 uncorrected Cluster size >10. S=seconds. Error bars represent standard deviation.

