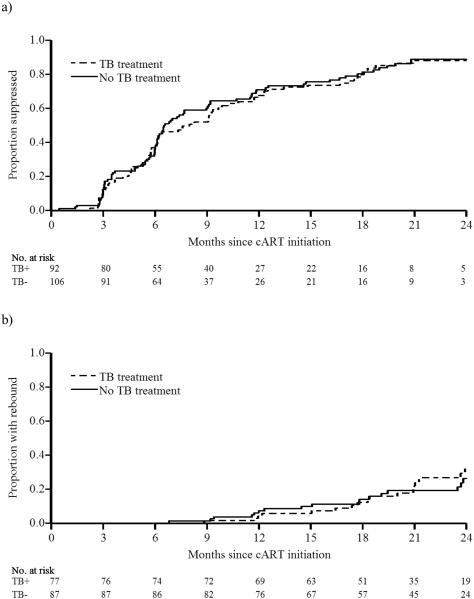
Figure 1. Kaplan-Meier graphs of virologic response, stratified by TB treatment status at cART initiation.
(a) Time to first virologic suppression. (b) Time to virologic rebound. Abbreviations: cART, combination antiretroviral therapy; TB, tuberculosis; TB+, receiving TB treatment at cART initiation; TB−, not receiving TB treatment at cART initiation.

