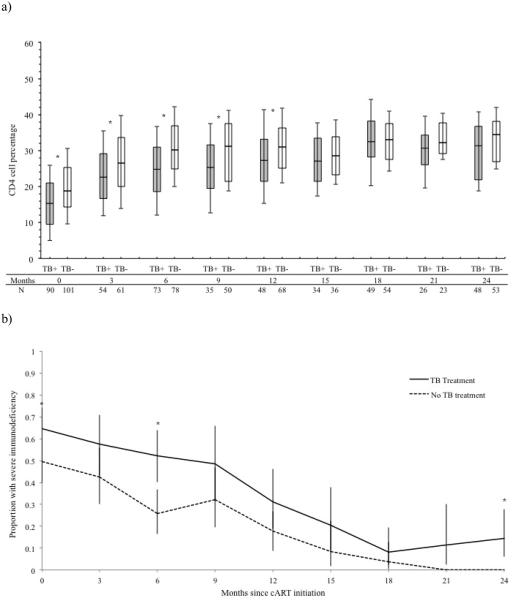
Figure 2. Graphs of immunologic response, stratified by TB treatment status at cART initiation.
(a) Observed CD4 cell percentage evolutions among children receiving TB treatment and children not receiving TB treatment. Each box plot depicts the median and interquartile range, with the error bars marking the 10th and 90th percentiles. Time is indicated in months since cART initiation. The number of children in each group with a CD4 cell percentage measurement at each time point is indicated. (b) Proportion of children with severe age-specific immunodeficiency, with exact 95% confidence limits. * indicates a statistically significant difference between those receiving vs. not receiving TB treatment at that time point (P <0.05). Abbreviations: cART, combination antiretroviral therapy; TB, tuberculosis; TB+, receiving TB treatment at cART initiation; TB−, not receiving TB treatment at cART initiation.

